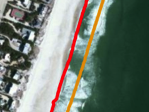
 Shoreline Change: Estimates of the extent of shoreline change due to Super Storm Sandy.
|
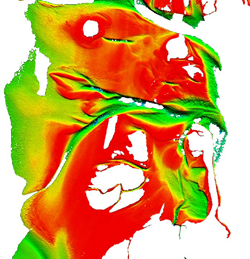
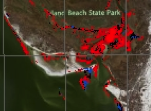 Deposition/Erosion: Maps of the areas where material has been deposited and/or eroded due to the effects of Super Storm Sandy.
|
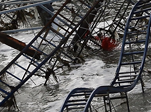 Marine Debris: Maps and examples of marine debris found in the Super Storm Sandy area, and results of the marine debris detection research.
|
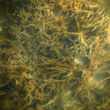 Habitat: Maps of seagrass extent in areas affected by Super Storm Sandy, and auxiliary properties estimated from them, and to support the research.
|
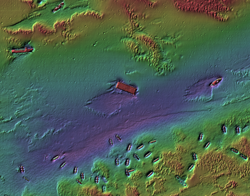
 Lidar Data: Estimates of lidar waveforms, characterizations of areas affected by Super Storm Sandy derived from these, and water-column properties.
|
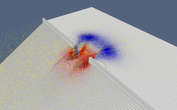
 Sonar Data: Examples of data from PMBS systems in the Super Storm Sandy area, illustrating the processing methods being developed through the research.
|
 Coastal Engineering Indices: Examples of indicator maps that can be used to assist in the development of Coastal Engineering Indices, derived from data in the Super Storm Sandy area.
|
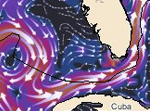 Visualization Gallery: Examples of visualizations generated during the course of the research being conducted that can be used as static representations.
|