
You are here
Visualization Gallery
Data on its own is only part of the story: it needs to be turned into information in order to be useful. Based on our experience with this, we firmly believe that an interactive visualization environment that allows users to interactively explore their data is the best way to do this. Of interest here is how to automatically select the appropriate views of complex data that allows the user to best interpret the data, how to composite the various available data sources for more efficient investigation of targets, and how to communicate the meaning of data to users both professional and public.
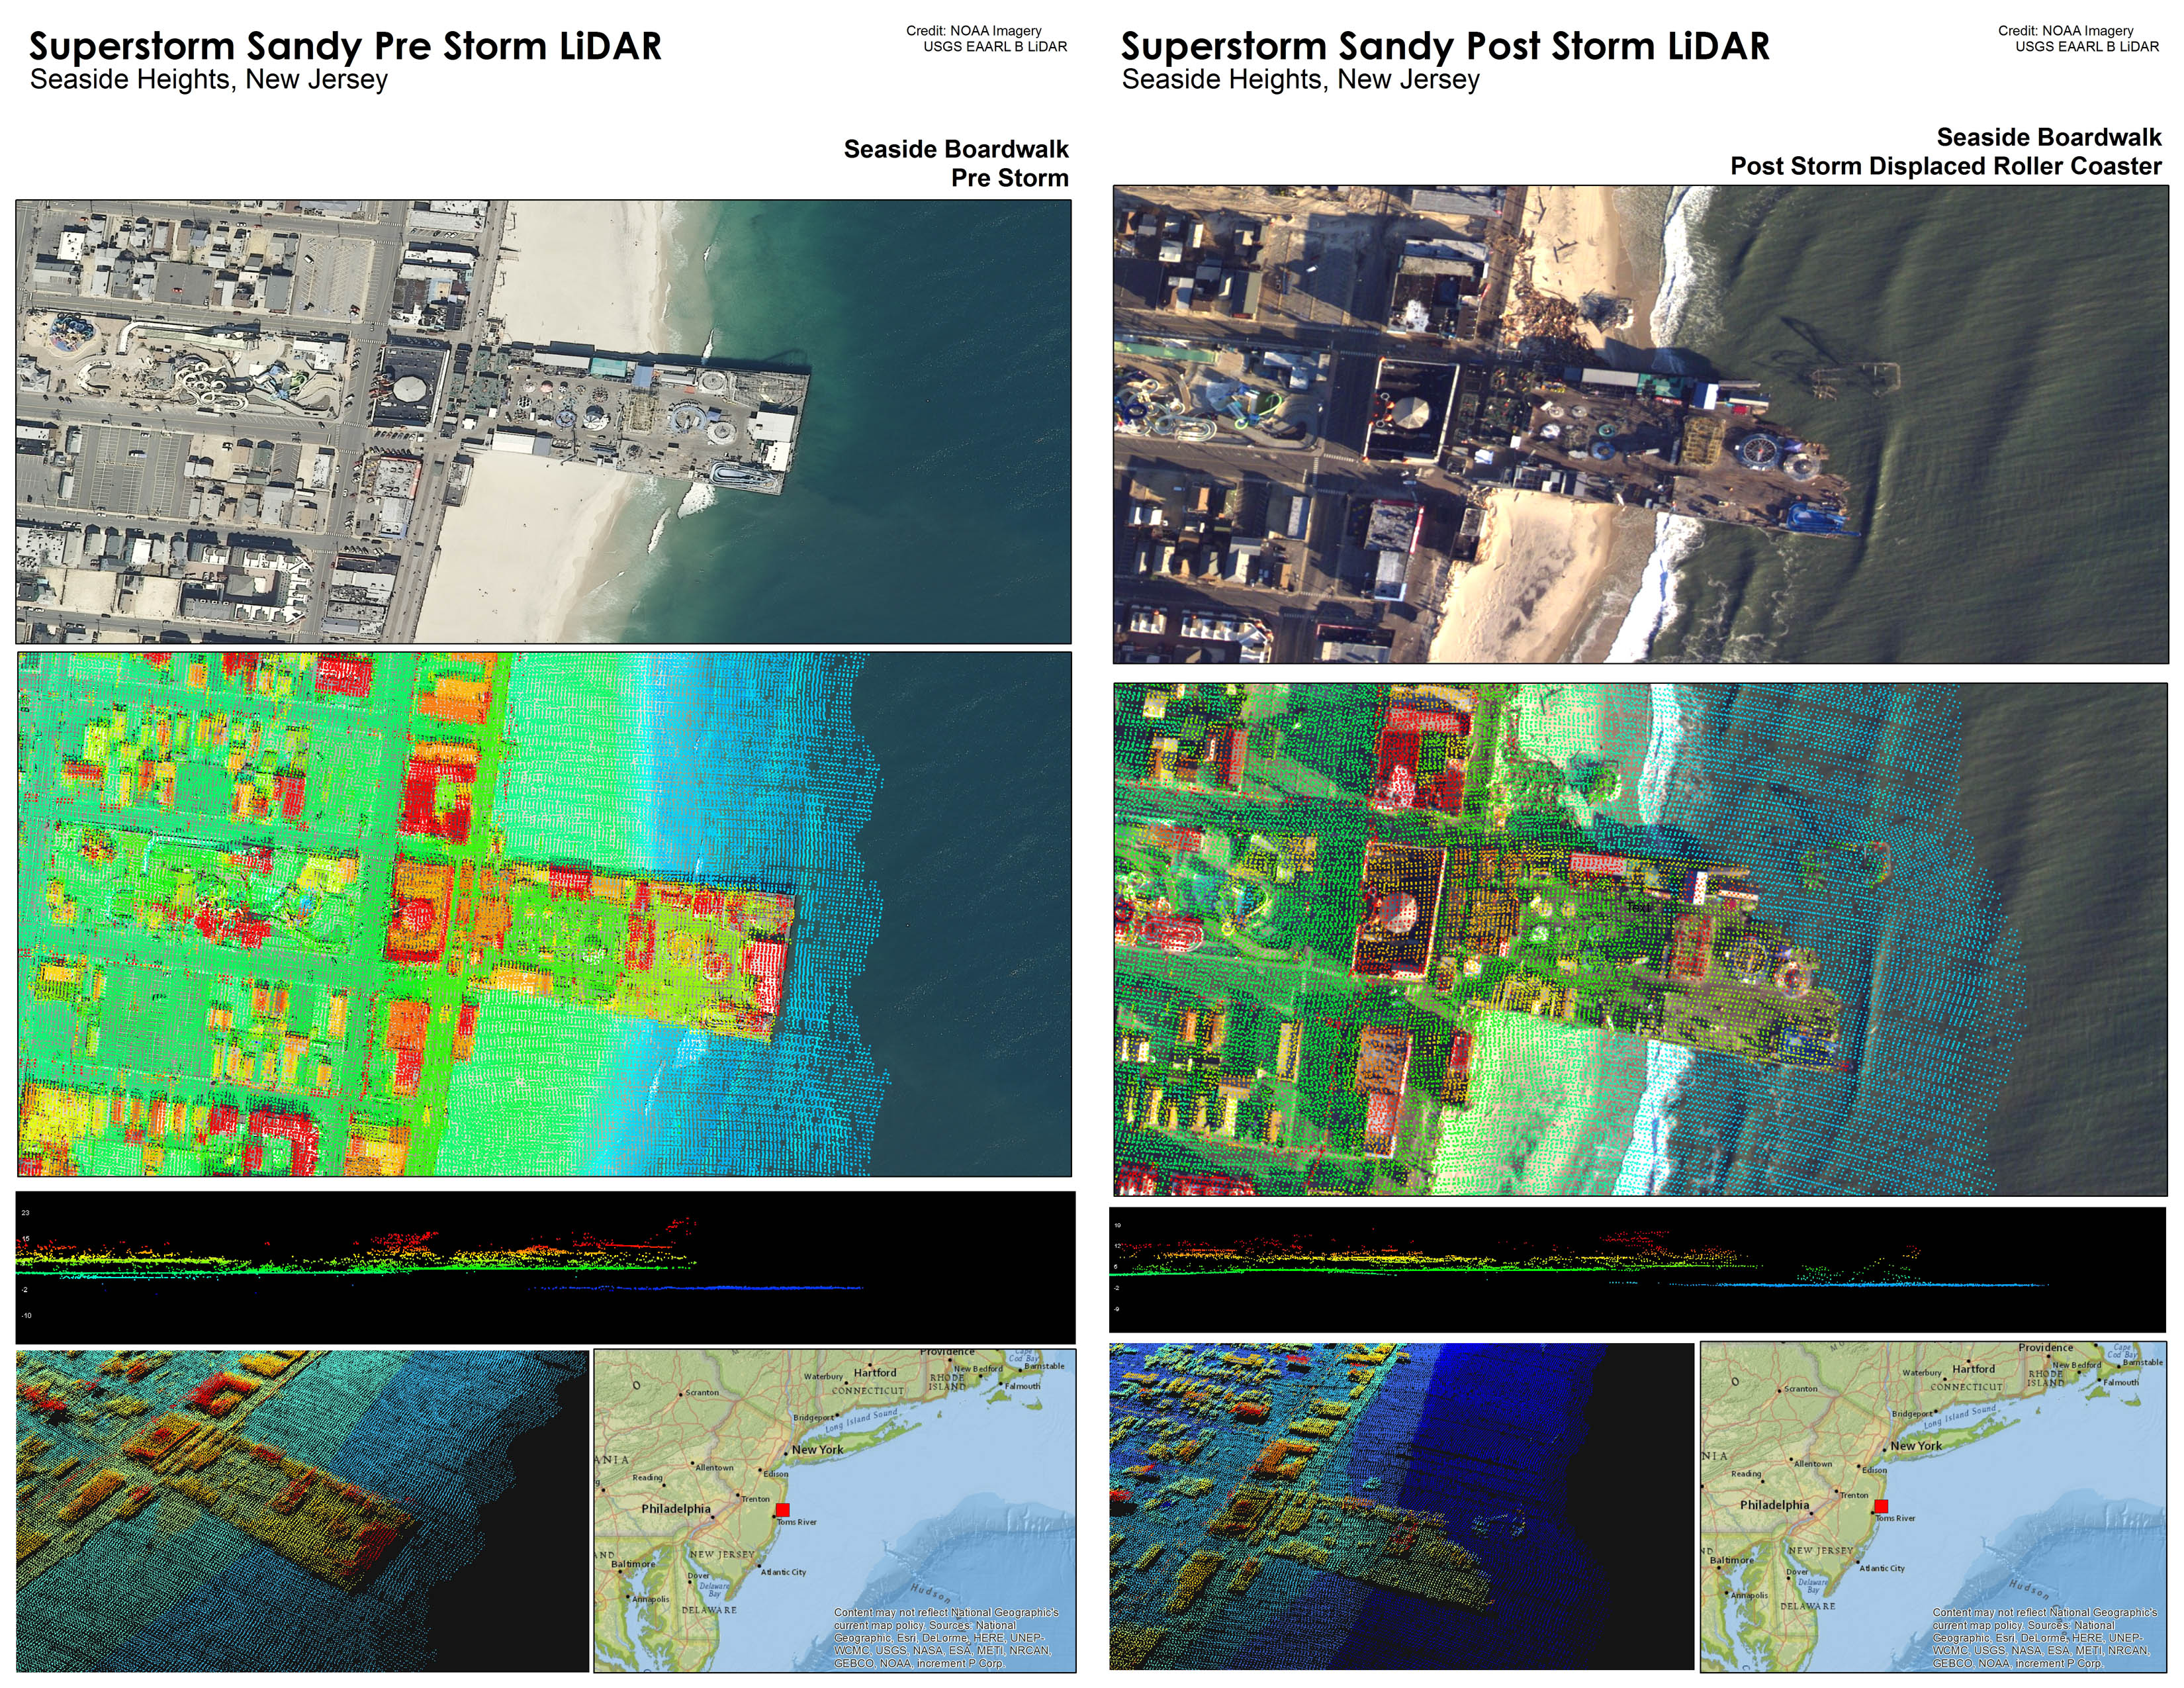
Outreach visualization of the damage caused by Super Storm Sandy on the Seaside Boardwalk rollercoaster (Seaside Heights, NJ) [2.2MB].
This visualization was put together for the UNH/Marine Program Ocean Discovery Day 2014 to illustrate the use of lidar data in a storm response scenario. Using a combination of NOAA photogrammetry data and US Geological Survey EAARL-B lidar data, the before and after displays illustrate the damage caused to the Seaside Boardwalk rollercoaster in Seaside Heights, NJ.
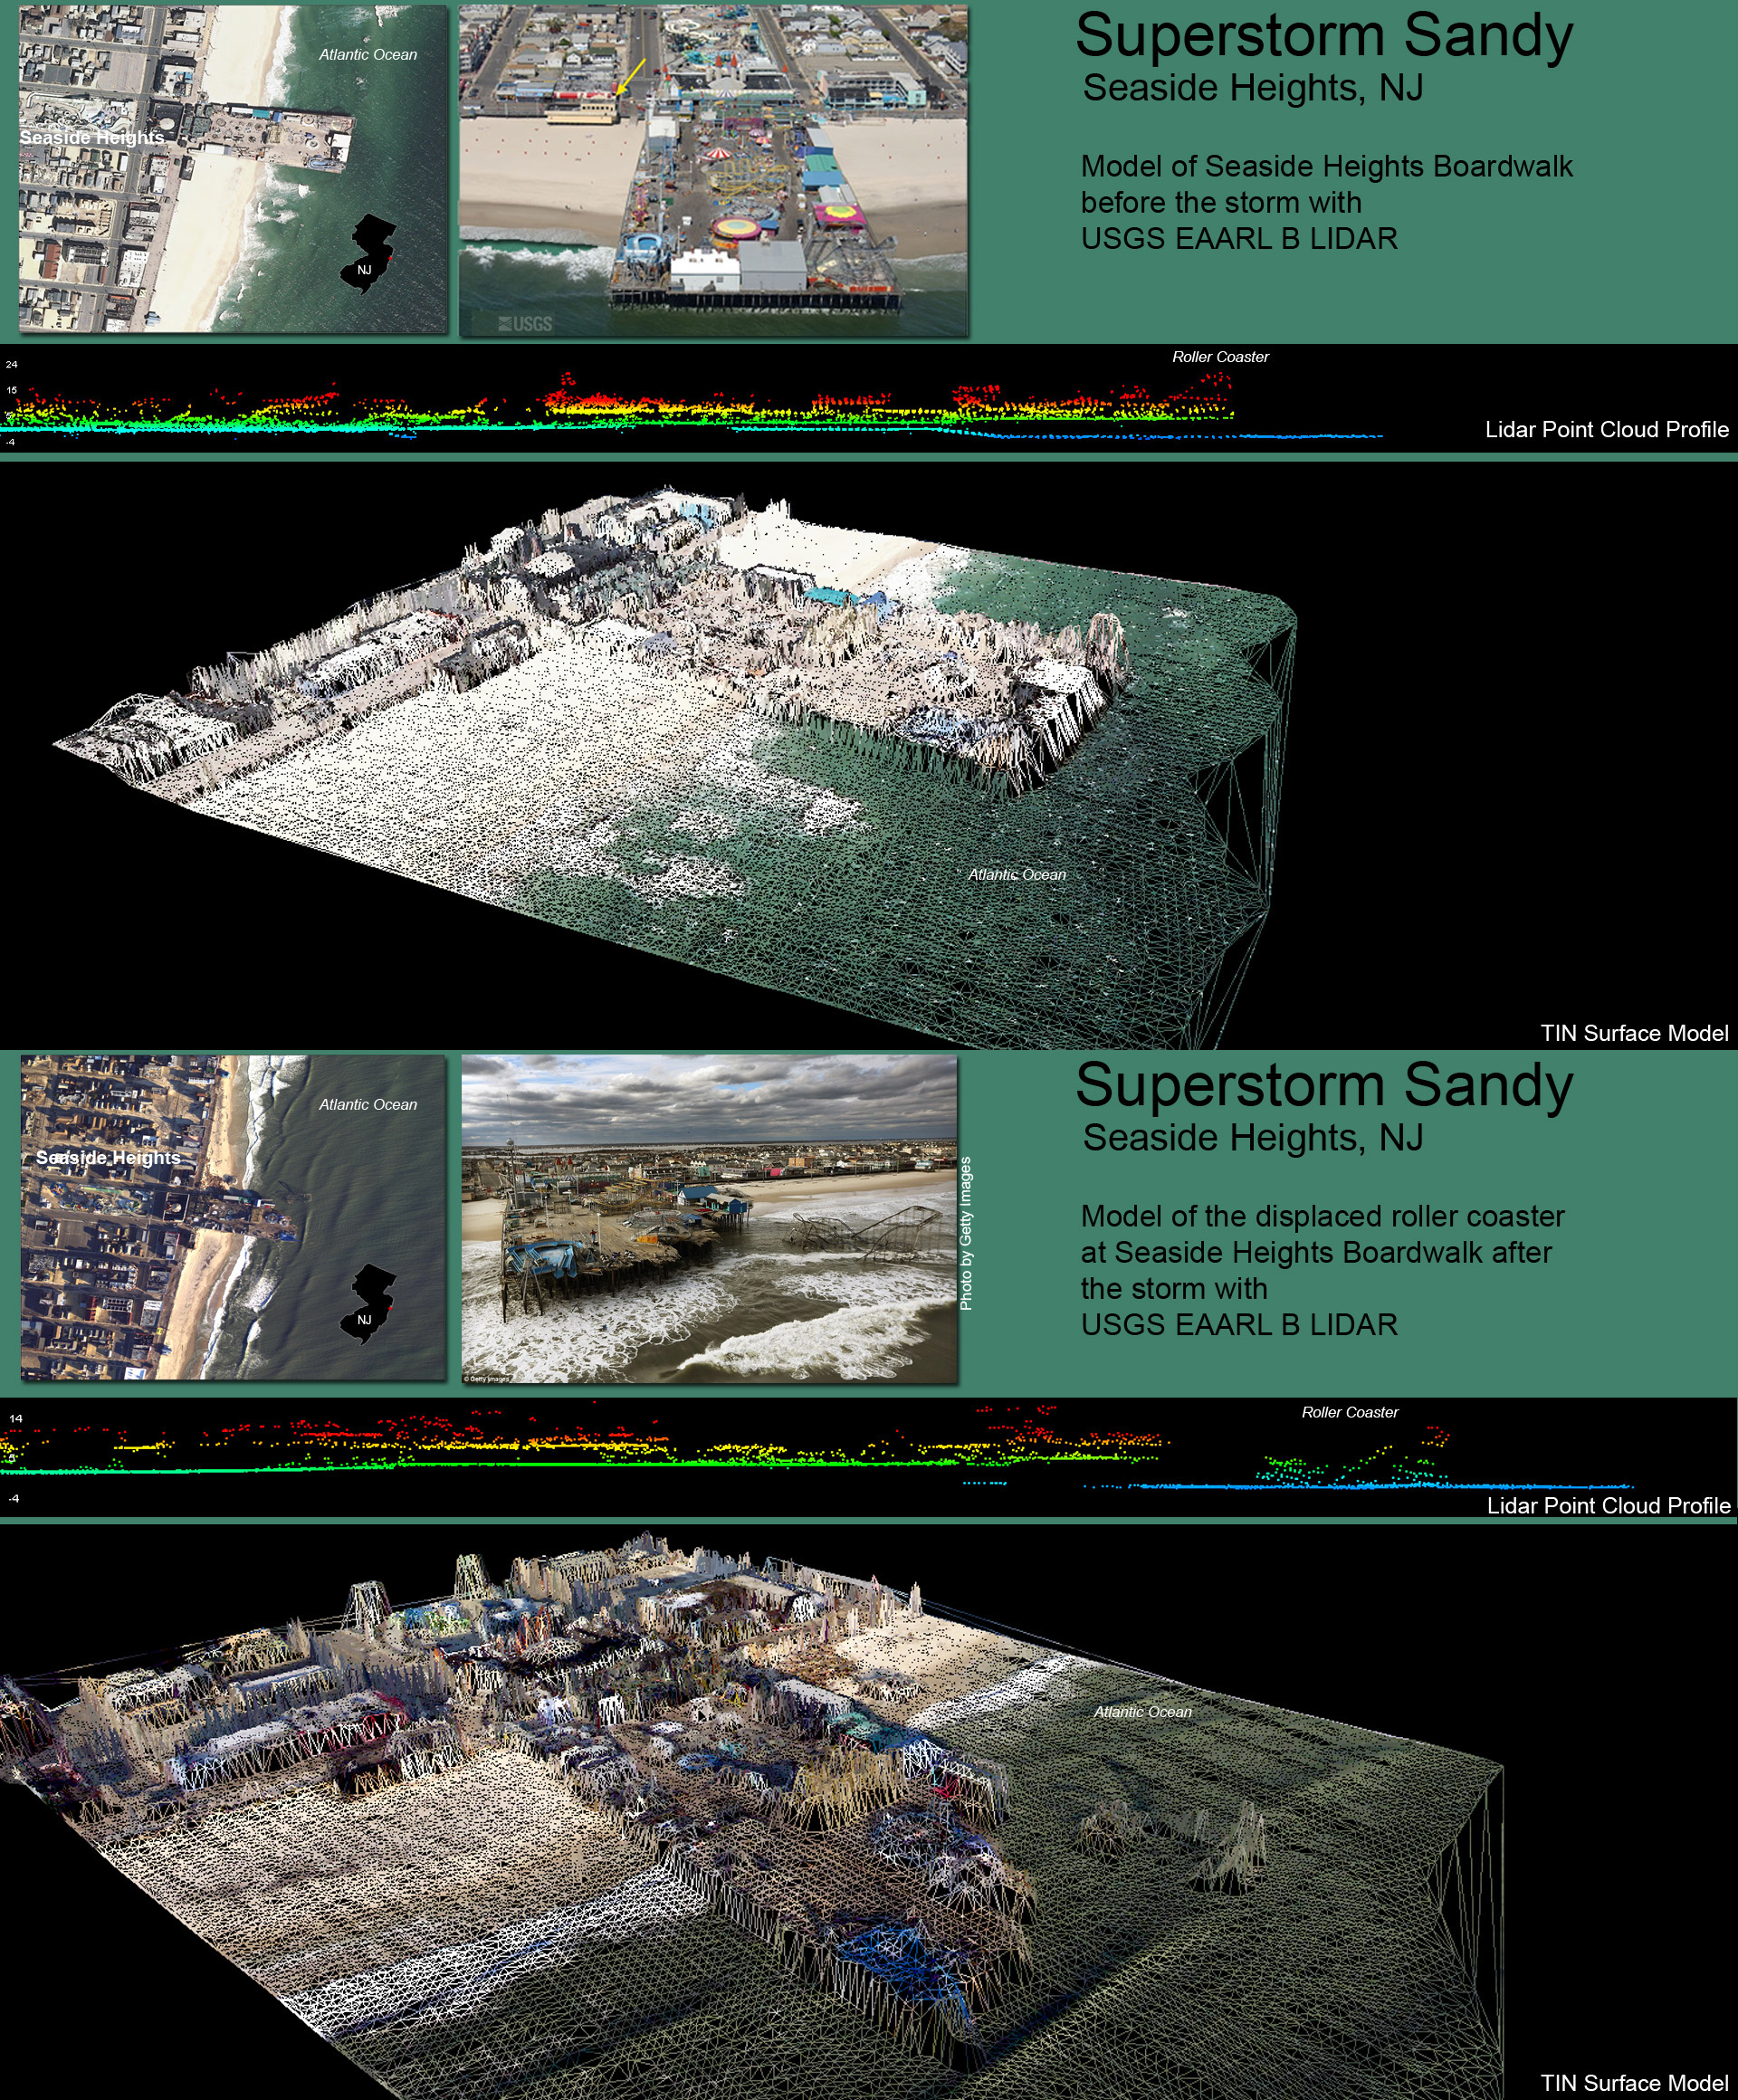
Outreach visualization of the damage caused by Super Storm Sandy on the Seaside Boardwalk rollercoaster (Seaside Heights, NJ) [2.0MB].
An alternative visualization of the Seaside Heights roller-coaster data. Using a combination of NOAA photogrammetry data and US Geological Survey EAARL-B lidar data, the before and after displays illustrate the damage caused to the Seaside Boardwalk rollercoaster in Seaside Heights, NJ.
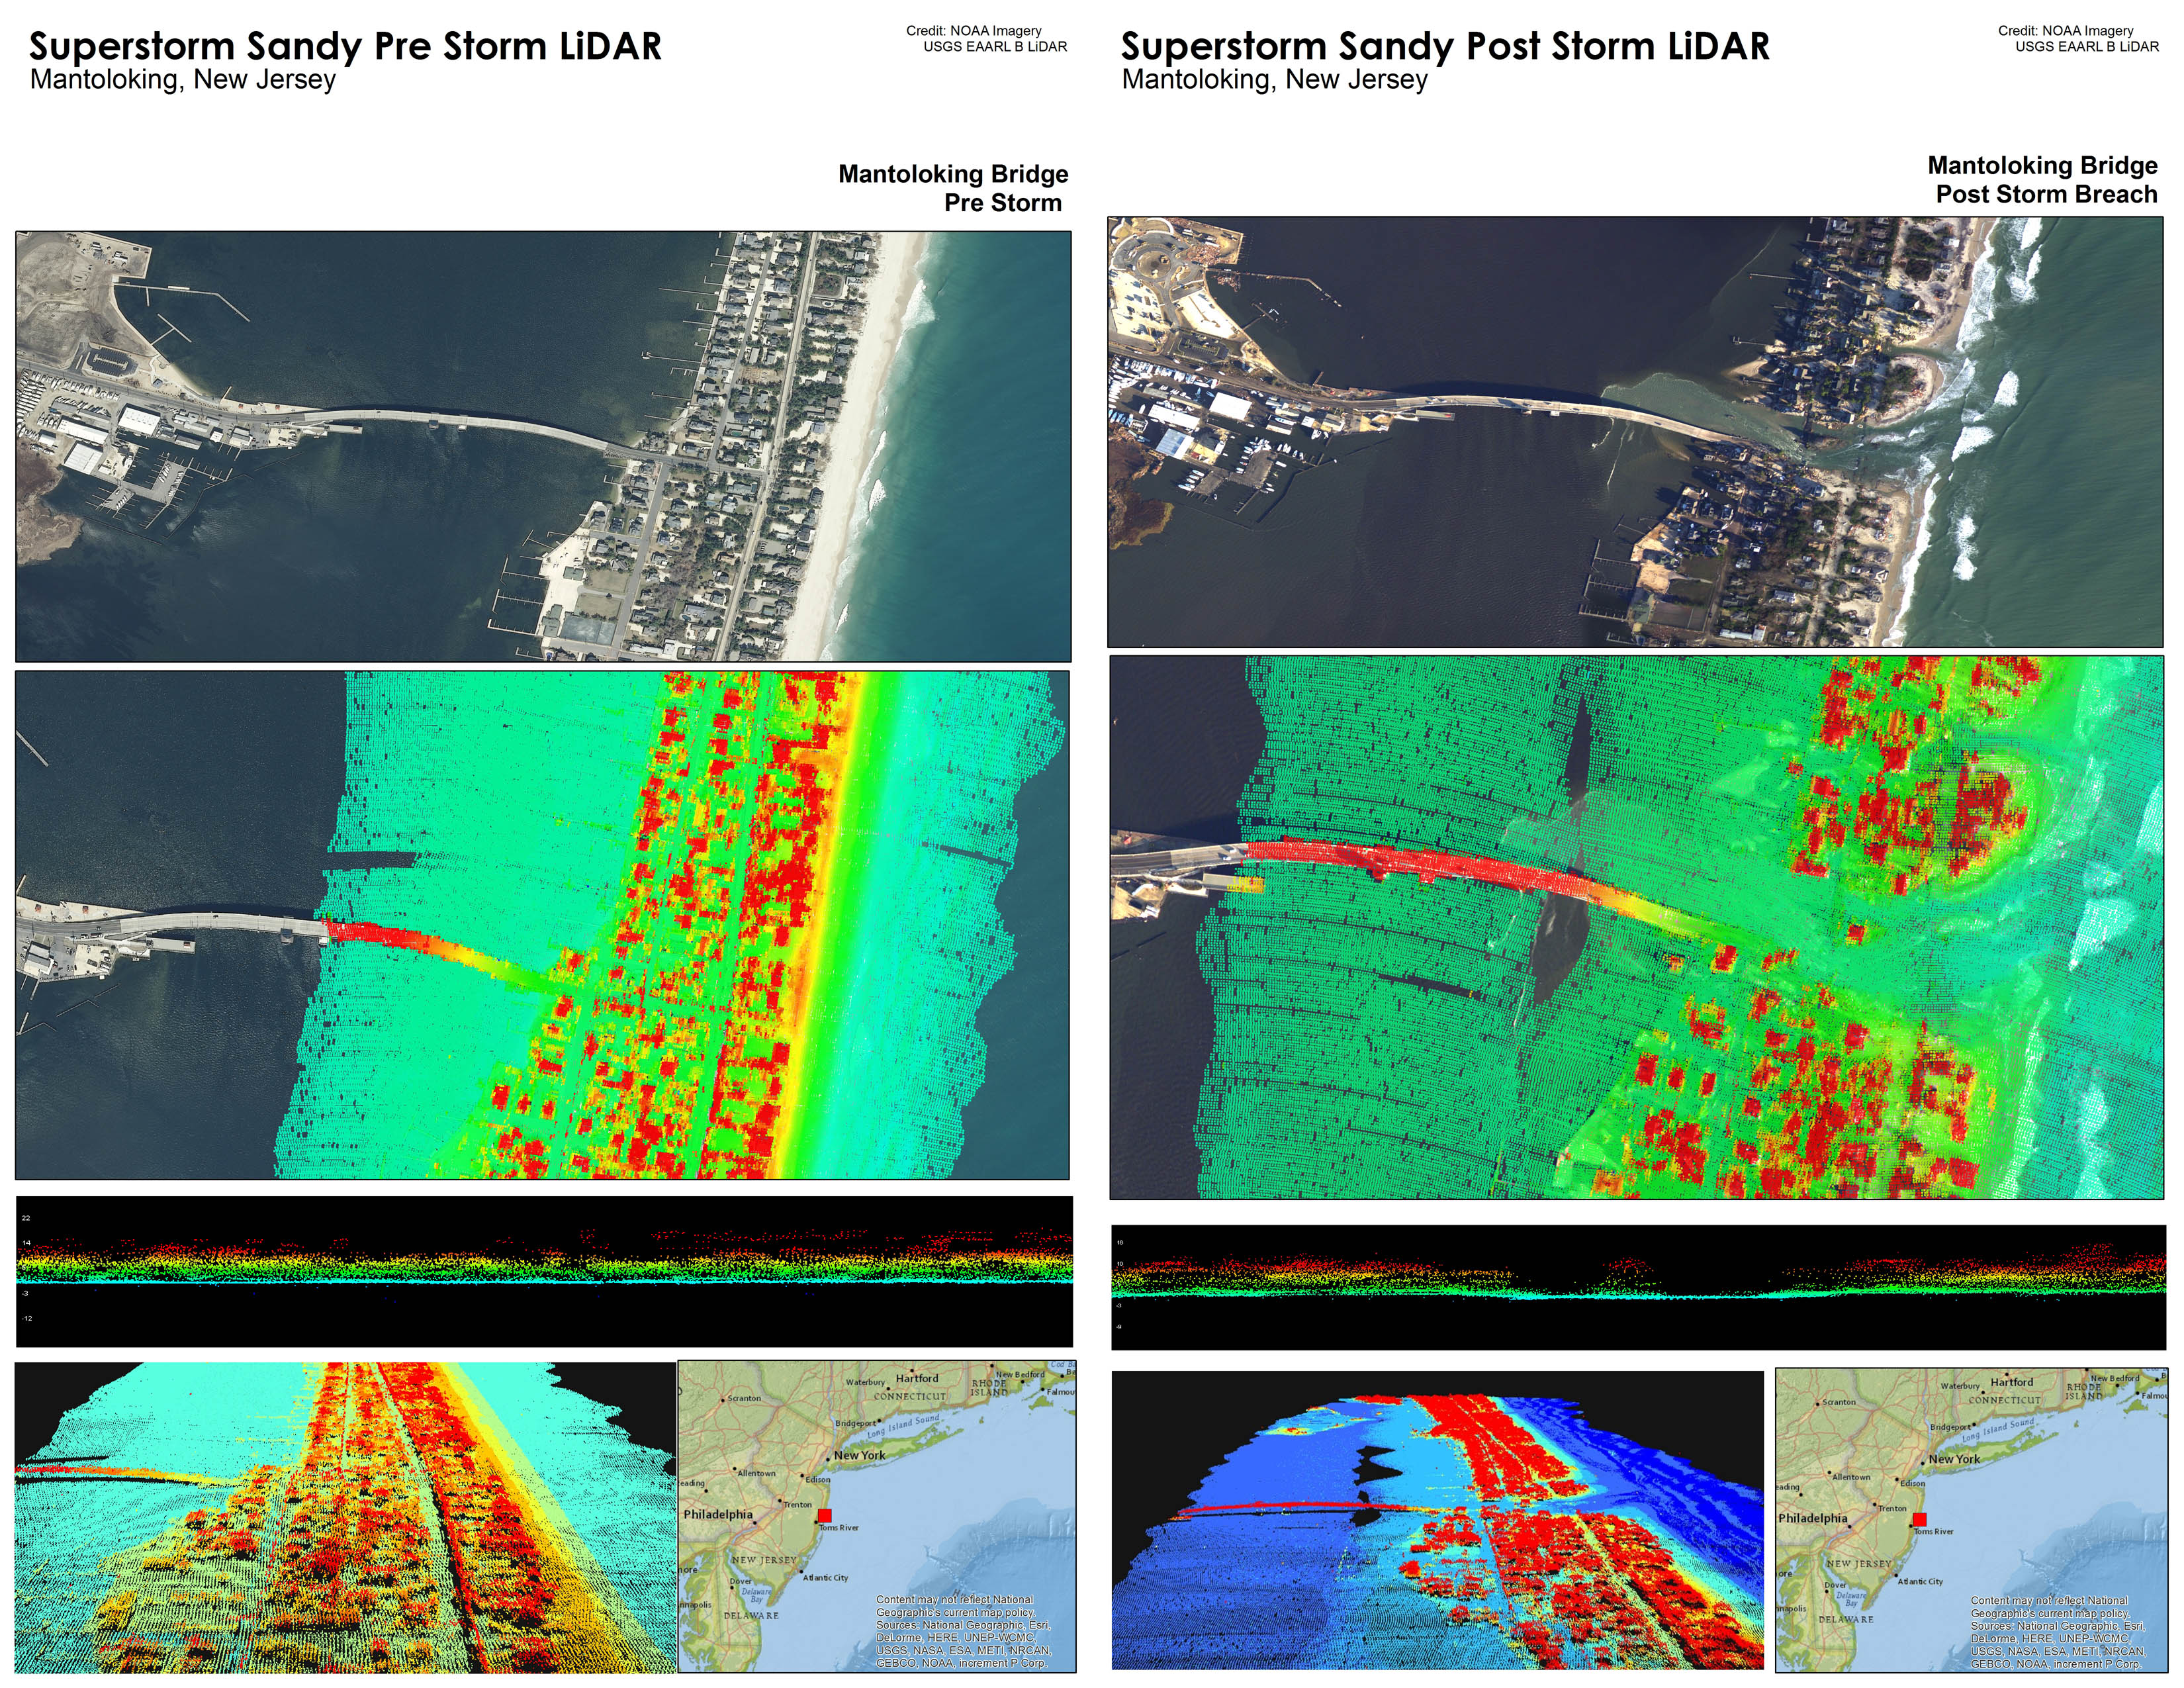
Outreach visualization of the changes caused by Super Storm Sandy in the region around the Mantoloking Bridge, NJ [1.9MB].
This visualization was put together for the UNH/Marine Program Ocean Discovery Day 2014 to illustrate the use of lidar data in a storm response scenario. Using a combination of NOAA photogrammetry data and US Geological Survey EAARL-B lidar data, the before and after displays illustrate the damage caused to the Mantoloking Bridge (Mantoloking, NJ) due to a barrier island breach caused by the storm.
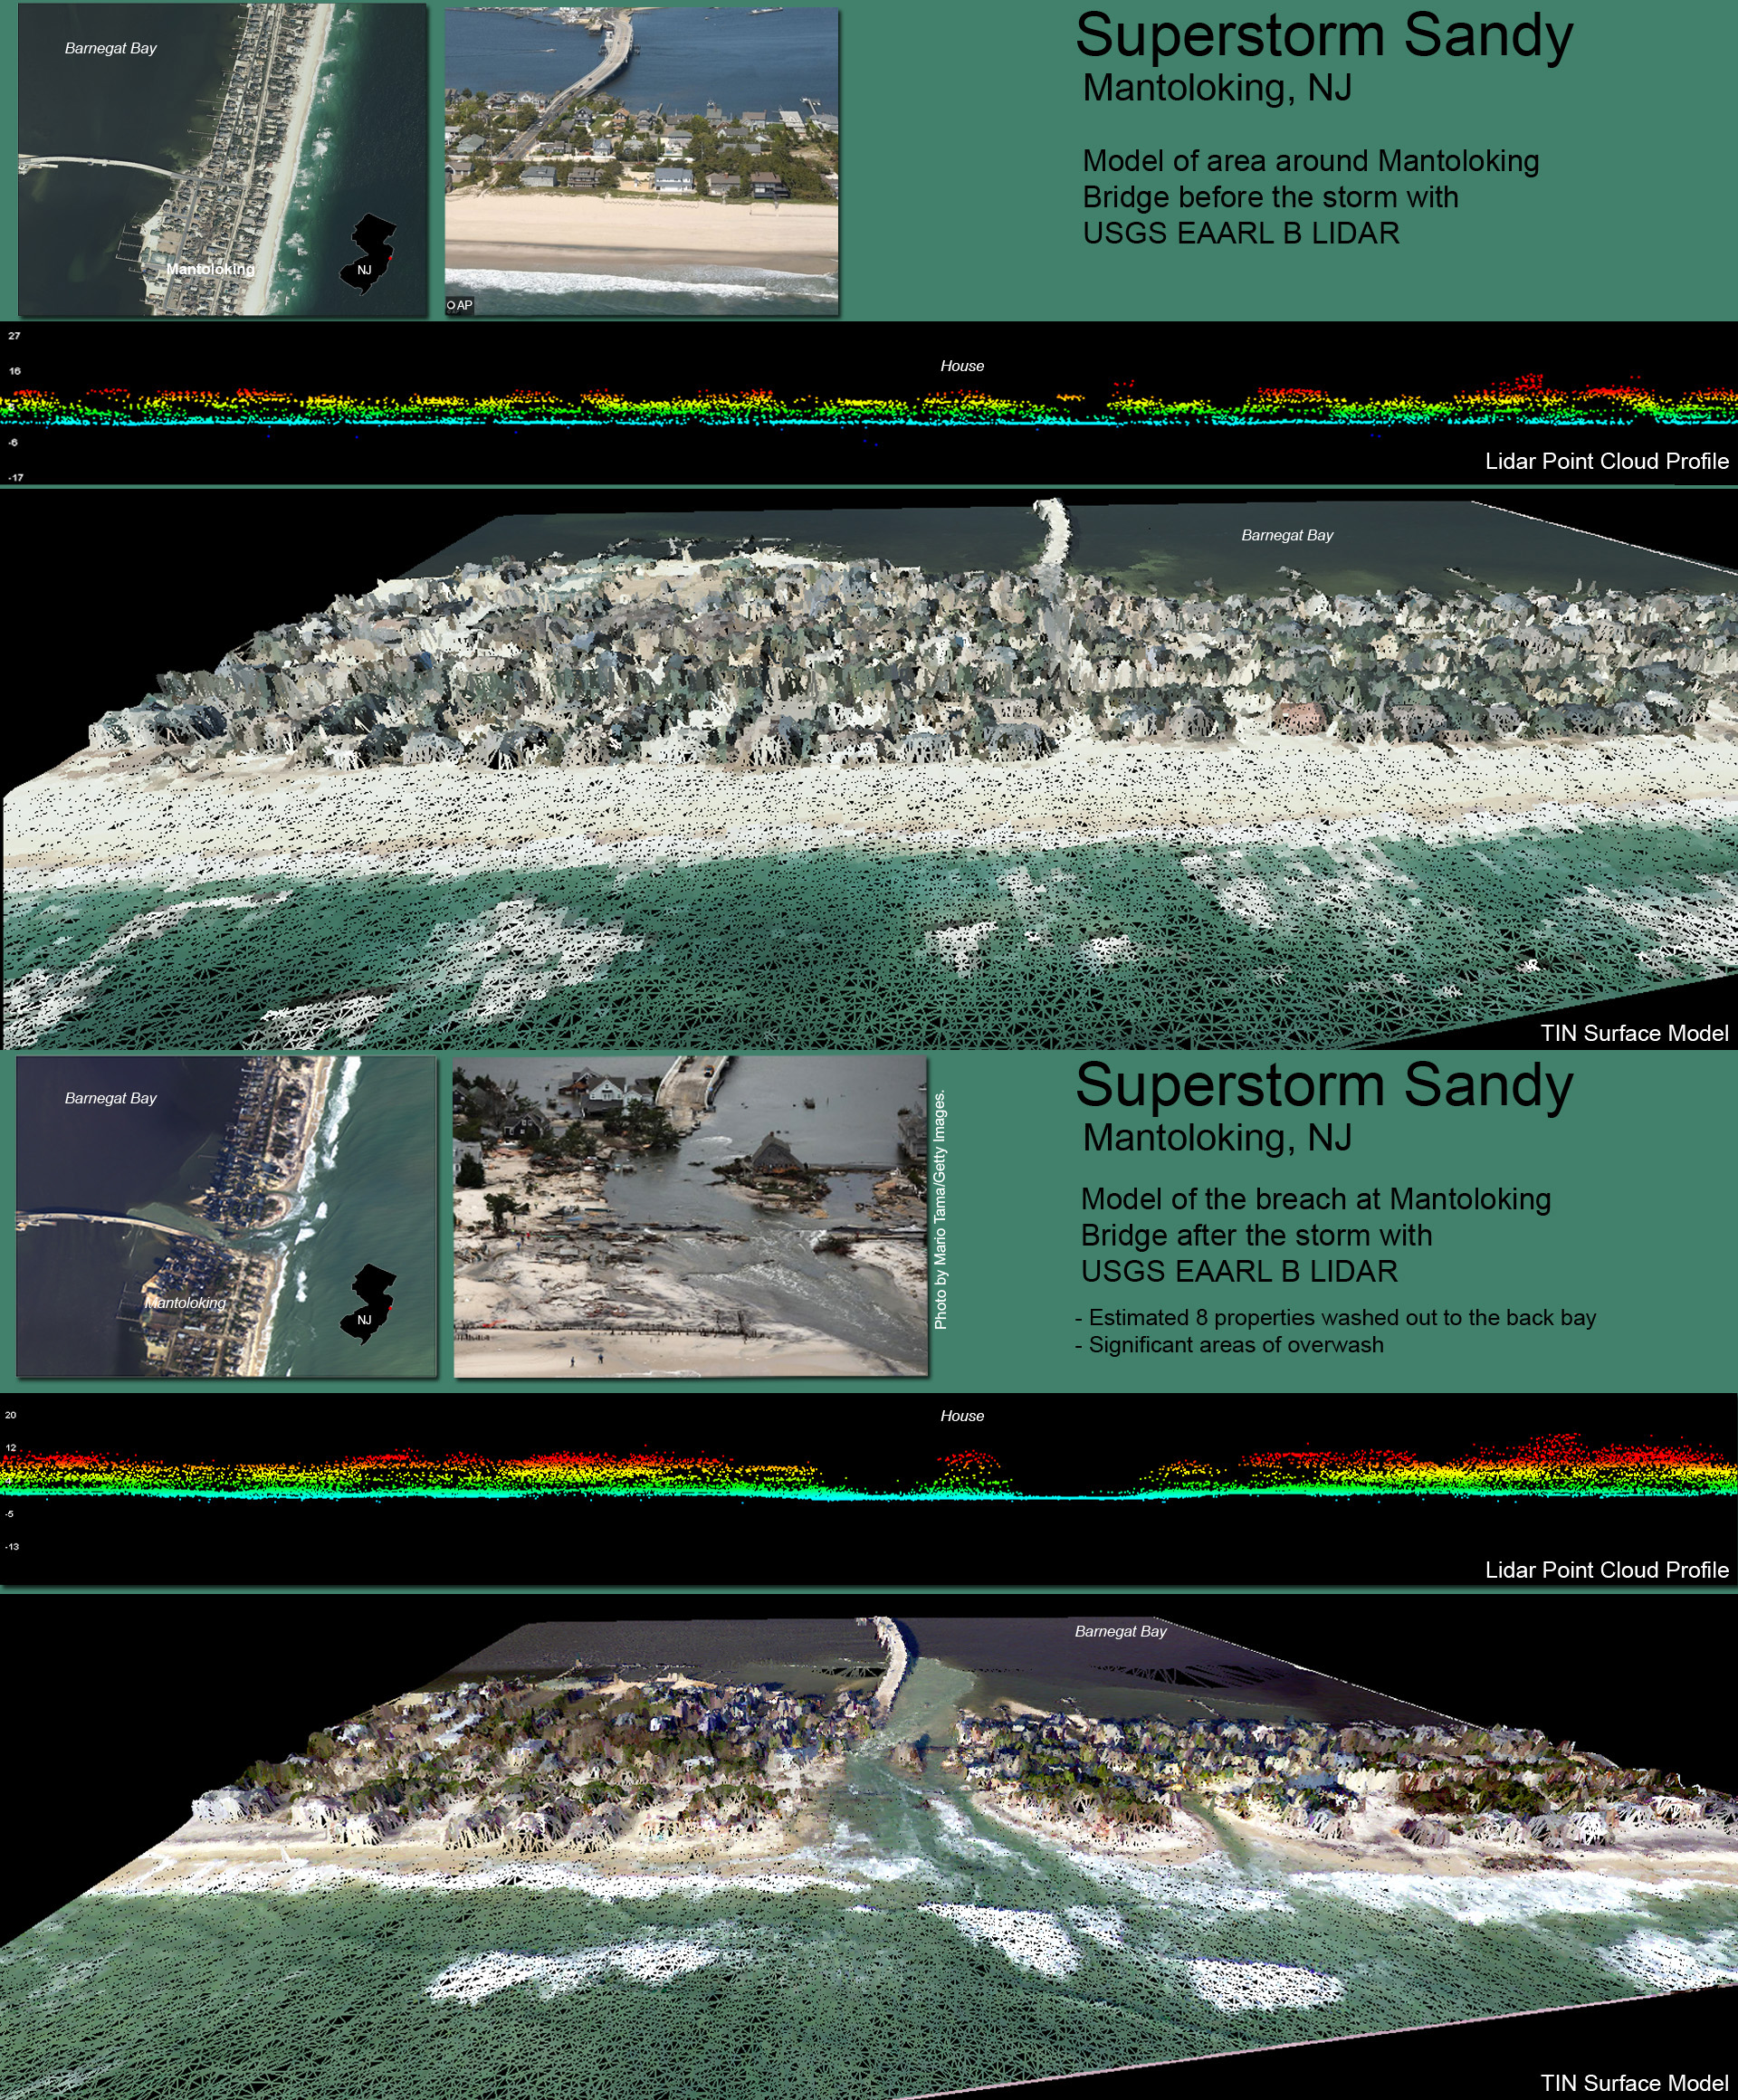
Outreach visualization of the changes caused by Super Storm Sandy in the region around the Mantoloking Bridge, NJ [2.1MB].
An alternative visualization of the Mantoloking Bridge data. Using a combination of NOAA photogrammetry data and US Geological Survey EAARL-B lidar data, the before and after displays illustrate the damage caused to the Mantoloking Bridge (Mantoloking, NJ) due to a barrier island breach caused by the storm.


