
You are here
Research Themes
The Super Storm Sandy research consists of six separate themes all attempting to determine how to use current technology most efficiently in a storm response situation, how to assess the effects of a storm, and methods for managing and processing the data collected.
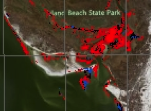
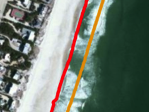 Shoreline Change: Shoreline has a number of possible definitions, depending on the application. Whichever is used, however, the effects of storm surge can cause significant change in the location of the indicated boundary between water and land either through reconfiguration of the existing sediments, erosion, or deposition. We are using lidar and optical imagery to find rapid shoreline determination methods with associated uncertainty.
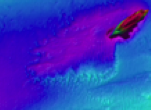 Sonar Data Processing: Rapidly re-surveying areas affected by storm events is essential in re-opening ports and channels for relief supplies, and in determining the position and type of material that may have been swept into the ocean. Phase differencing bathymetric sonars have a number of potential benefits for this task. We are investigating improved methods for PDBS data processing and protocols for their use in storm response.
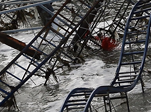 Marine Debris: Marine debris is anything in the water that is not naturally present. After a significant storm event, much anthropogenic material can be deposited in the ocean: wrecked boats, fishing tackle, buildings, even cars. Successfully and rapidly locating and identifying marine debris is the first stage of determining what to remove, and how to remove it. We are building algorithms to analyze a variety of data to rapidly identify marine debris, and automatically populate databases.
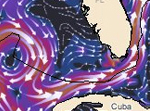 Visualization: Data on its own is important, but only truly becomes useful when it is effectively turned into information. This is especially true when the data has to be communicated to policy-makers, field operations, and the general public. We are developing methods for interactive visualization of data collected for storm response so that decision makers have the best available information for efficient decision making, and on infographics to communicate current conditions to the general public.
 Lidar Data Processing: Lidar data can be useful in storm response, since it can be gathered rapidly from the air, potentially without a local ground presence. When infrastructure is compromised, this can be a significant benefit. We are developing methods to rapidly assess and process lidar data into useful products such as shoreline and erosion/deposition maps, and to extract further indicators of change from the watercolumn, and lidar waveforms, that may be useful for storm response mapping.
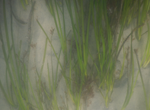 Habitat: Seagrass can provide a number of important ecological roles, including habitat for fish, filtering suspended sediments, and stabilizing sediments. A significant storm event can cause widespread damage, however, and monitoring these areas by hand can be very time consuming. We are developing methods to use airborne lidar and optical data to monitor seagrass remotely, and to attempt to differentiate between seagrass and macroalgae.


