
You are here
Deposition/Erosion
We are developing methods for rapid estimation of erosion and deposition from remote sensing data in the Super Storm Sandy-affected areas, particularly around the Barnegat Bay, NJ. We are focusing specifically on use of lidar data for this, since it can be rapidly collected in a response situation and quickly turned around to provide rapid feedback on the current situation in the aftermath of a storm event.
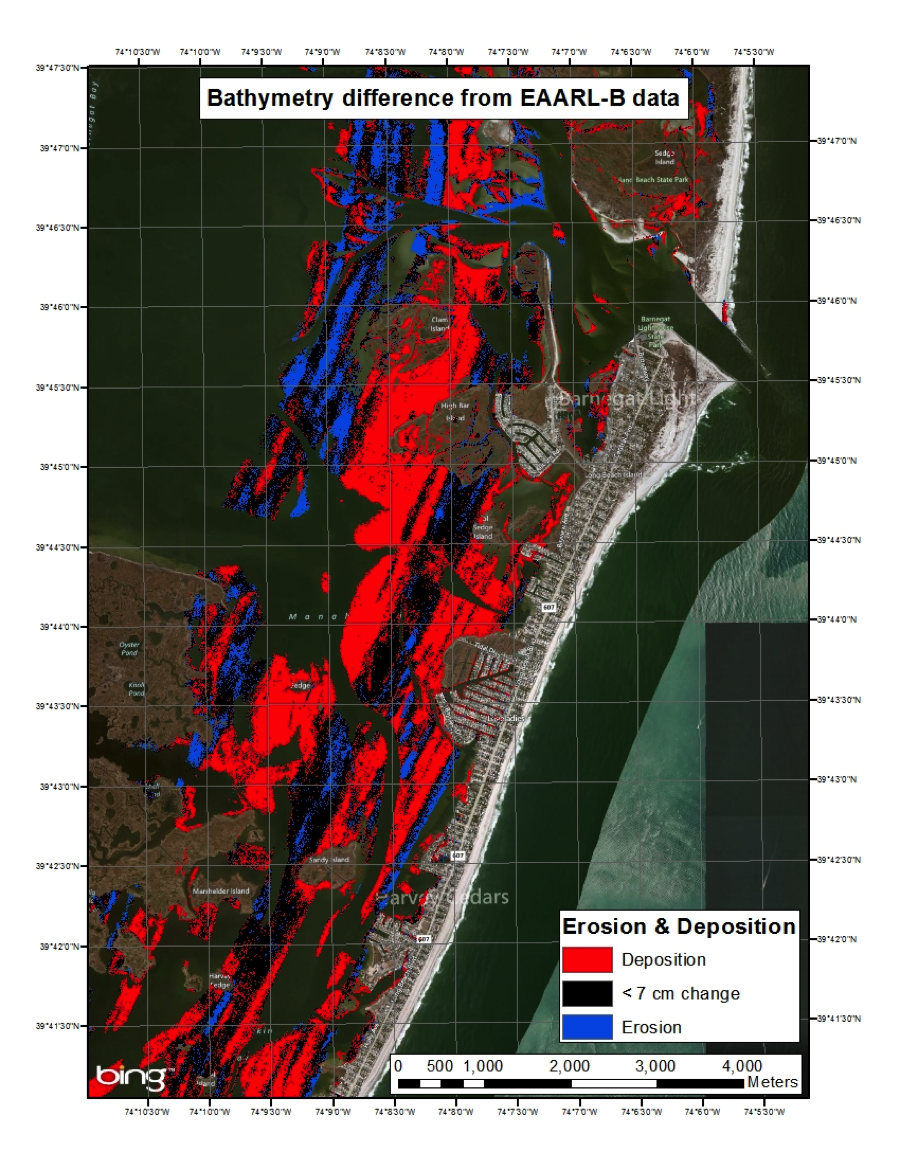
Estimate of erosion/deposition in Barnegat Bay, NJ due to Super Storm Sandy [1.4MB].
This data, derived from U.S. Geological Survey LIDAR data observed using the EAARL-B (Experimental Advanced Airborne Research Lidar), illustrates the erosion (red areas) and deposition (blue areas) in Barnegat Bay, NJ due to the effects of Super Storm Sandy. Estimates of uncertainty for the data were constructed, concluding that an uncertainty of 0.07m (one standard deviation) was appropriate for the data; areas with less change than this are reported as "inconclusive". The raw data was read through LAStools, converted to the appropriate datum using VDATUM, gridded using QPS Fledermaus, and then processed with ArcGIS to generate the shorelines. Differences of grids from before and after the storm are then computed to determine areas of erosion and deposition. Note that the data used for this analysis was preliminary, and therefore still contains some processing artifacts that will be resolved in the production data. This sort of problem is likely to occur in response situations.

Estimate of bathymetric change in Barnegat Bay, NJ due to Super Storm Sandy [460kB].
This data, taken far from the mouth of Barnegat Bay Inlet, shows remarkably little change after the storm, except for a distinct localized change in the location of a channel edge at approximately 900m along transect. Data derived from EAARL-B surveys, courtesy of the US Geological Survey.
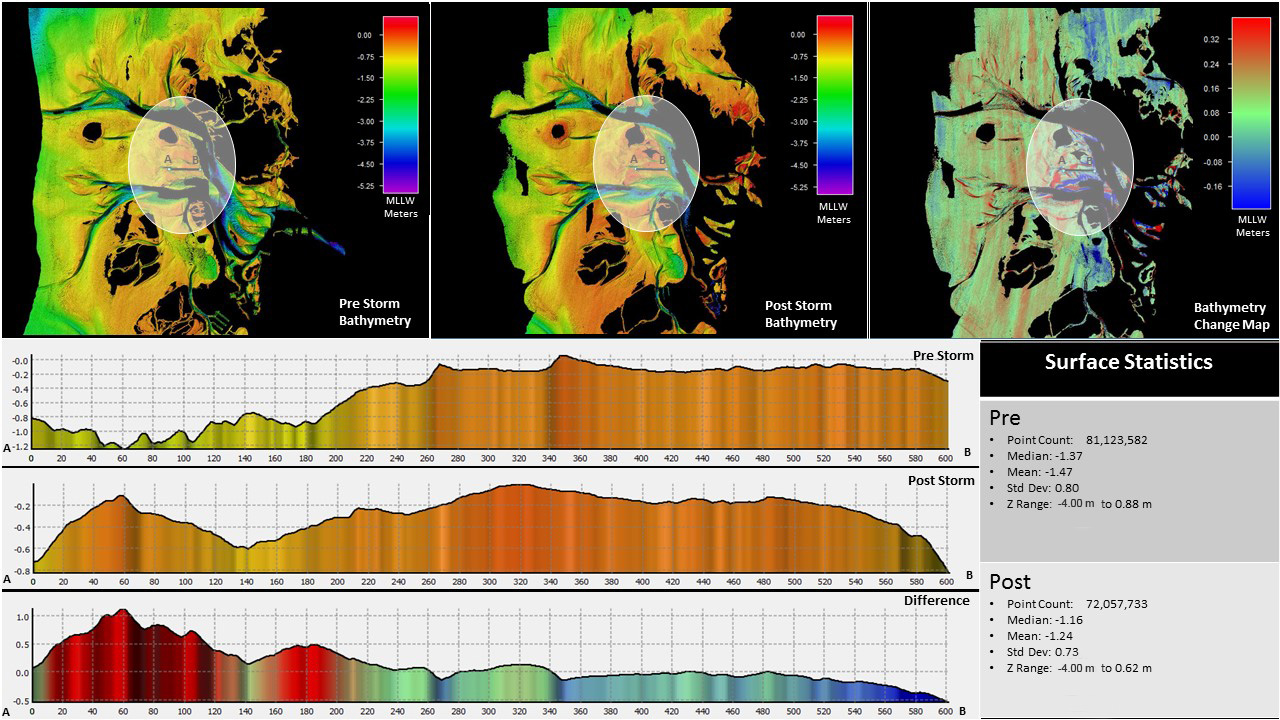
Estimate of bathymetric change in Barnegat Bay, NJ due to Super Storm Sandy [418kB].
This data, taken along a transect close to the mouth of Barnegat Bay Inlet, shows meter-level changes in the configuration due to the effects of the storm. Data derived from EAARL-B surveys, courtesy of the US Geological Survey.

Estimate of bathymetric change in Barnegat Bay, NJ due to Super Storm Sandy [391kB].
This data, taken in a transect across a channel in Barnegat Bay, shows a significant shift of the channel, and a change in morphology due to the effects of the storm. Data derived from EAARL-B surveys, courtesy of the US Geological Survey.


