You are here
Habitat Research
Background
 Super Storm Sandy made landfall on the U.S east coast near Brigantine, NJ, along the shore of Barnegat Bay. Barnegat Bay is a long, narrow, tidal shallow-water estuary on the coastline of central New Jersey. Its water mass extends approximately 70 km north-south and is separated from the ocean by a series of barrier islands in which exchange of bay and ocean waters occurs through three inlets. Record high storm surges were recorded in the Bay, resulting in ocean water washing over parts of Long Island into Barnegat Bay, creating strong currents, channels and sediment deposition that could affect benthic habitats (areas of the seafloor covered by flora or fauna). Within the bay are multiple benthic habitats that include seagrasses, hard clams, and macroalgae. Seagrasses comprise a particularly important habitat type in the estuary, as it provides structure for fish and shellfish species, filters suspended sediments and nutrients from the estuary and stabilizes sediments. Their populations have declined significantly in the last 20 years with a concurrent increase in the abundance of nuisance macroalgal species (Kennish et al., 2008, 2010, Kennish et al., 2012, Fertig et al., 2013).
Mapping Benthic Habitats
Damage caused by the storm could affect the abundance and distribution or cover of seagrass habitats. As seagrasses occur in relatively shallow water, a variety of remote-sensing techniques (e.g., lidar, optical imagery) can be used to assess the distribution and relative percent cover of this habitat. Towards this goal, we are exploring the use of waveform features extracted from topographic-bathymetric lidar systems (TBL) flown over Barnegat Bay, September, 2013 (the NOAA Riegl VQ-820-G), April, 2014 (Chiroptera; David Evans and Associates, NOAA/OCS/HSD), and shortly before and after Super Storm Sandy (USGS EAARL-B system) to classify seagrass and other benthic habitats in Barnegat Bay, and the use of multispectral satellite imagery, and aerial imagery combined with lidar derived bathymetry, to examine the effect of Super Storm Sandy on benthic habitats.
 As a first step towards mapping benthic habitats in Barnegat Bay using lidar data, we have extracted waveform features from the NOAA Riegl VQ-820-G system, lidar derived bathymetry and available aerial imagery to create a benthic habitat map (left: layers used in the analysis of submerged aquatic vegetation (SAV), including optical imagery and Chiroptera lidar data, courtesy of David Evans and Associates, NOAA/OCS/HSD). We are currently extending these methods to the Chiroptera TBL data and to the EAARL-B pre- and post-storm TBL data. The EAARL-B data, in particular, provides a unique opportunity to assess the immediate impact of the storm on benthic habitats as the TBL data was acquired for most of the estuary shortly before and after Super Storm Sandy (below right: pre and-post storm EAARL-B lidar derived bathymetry).
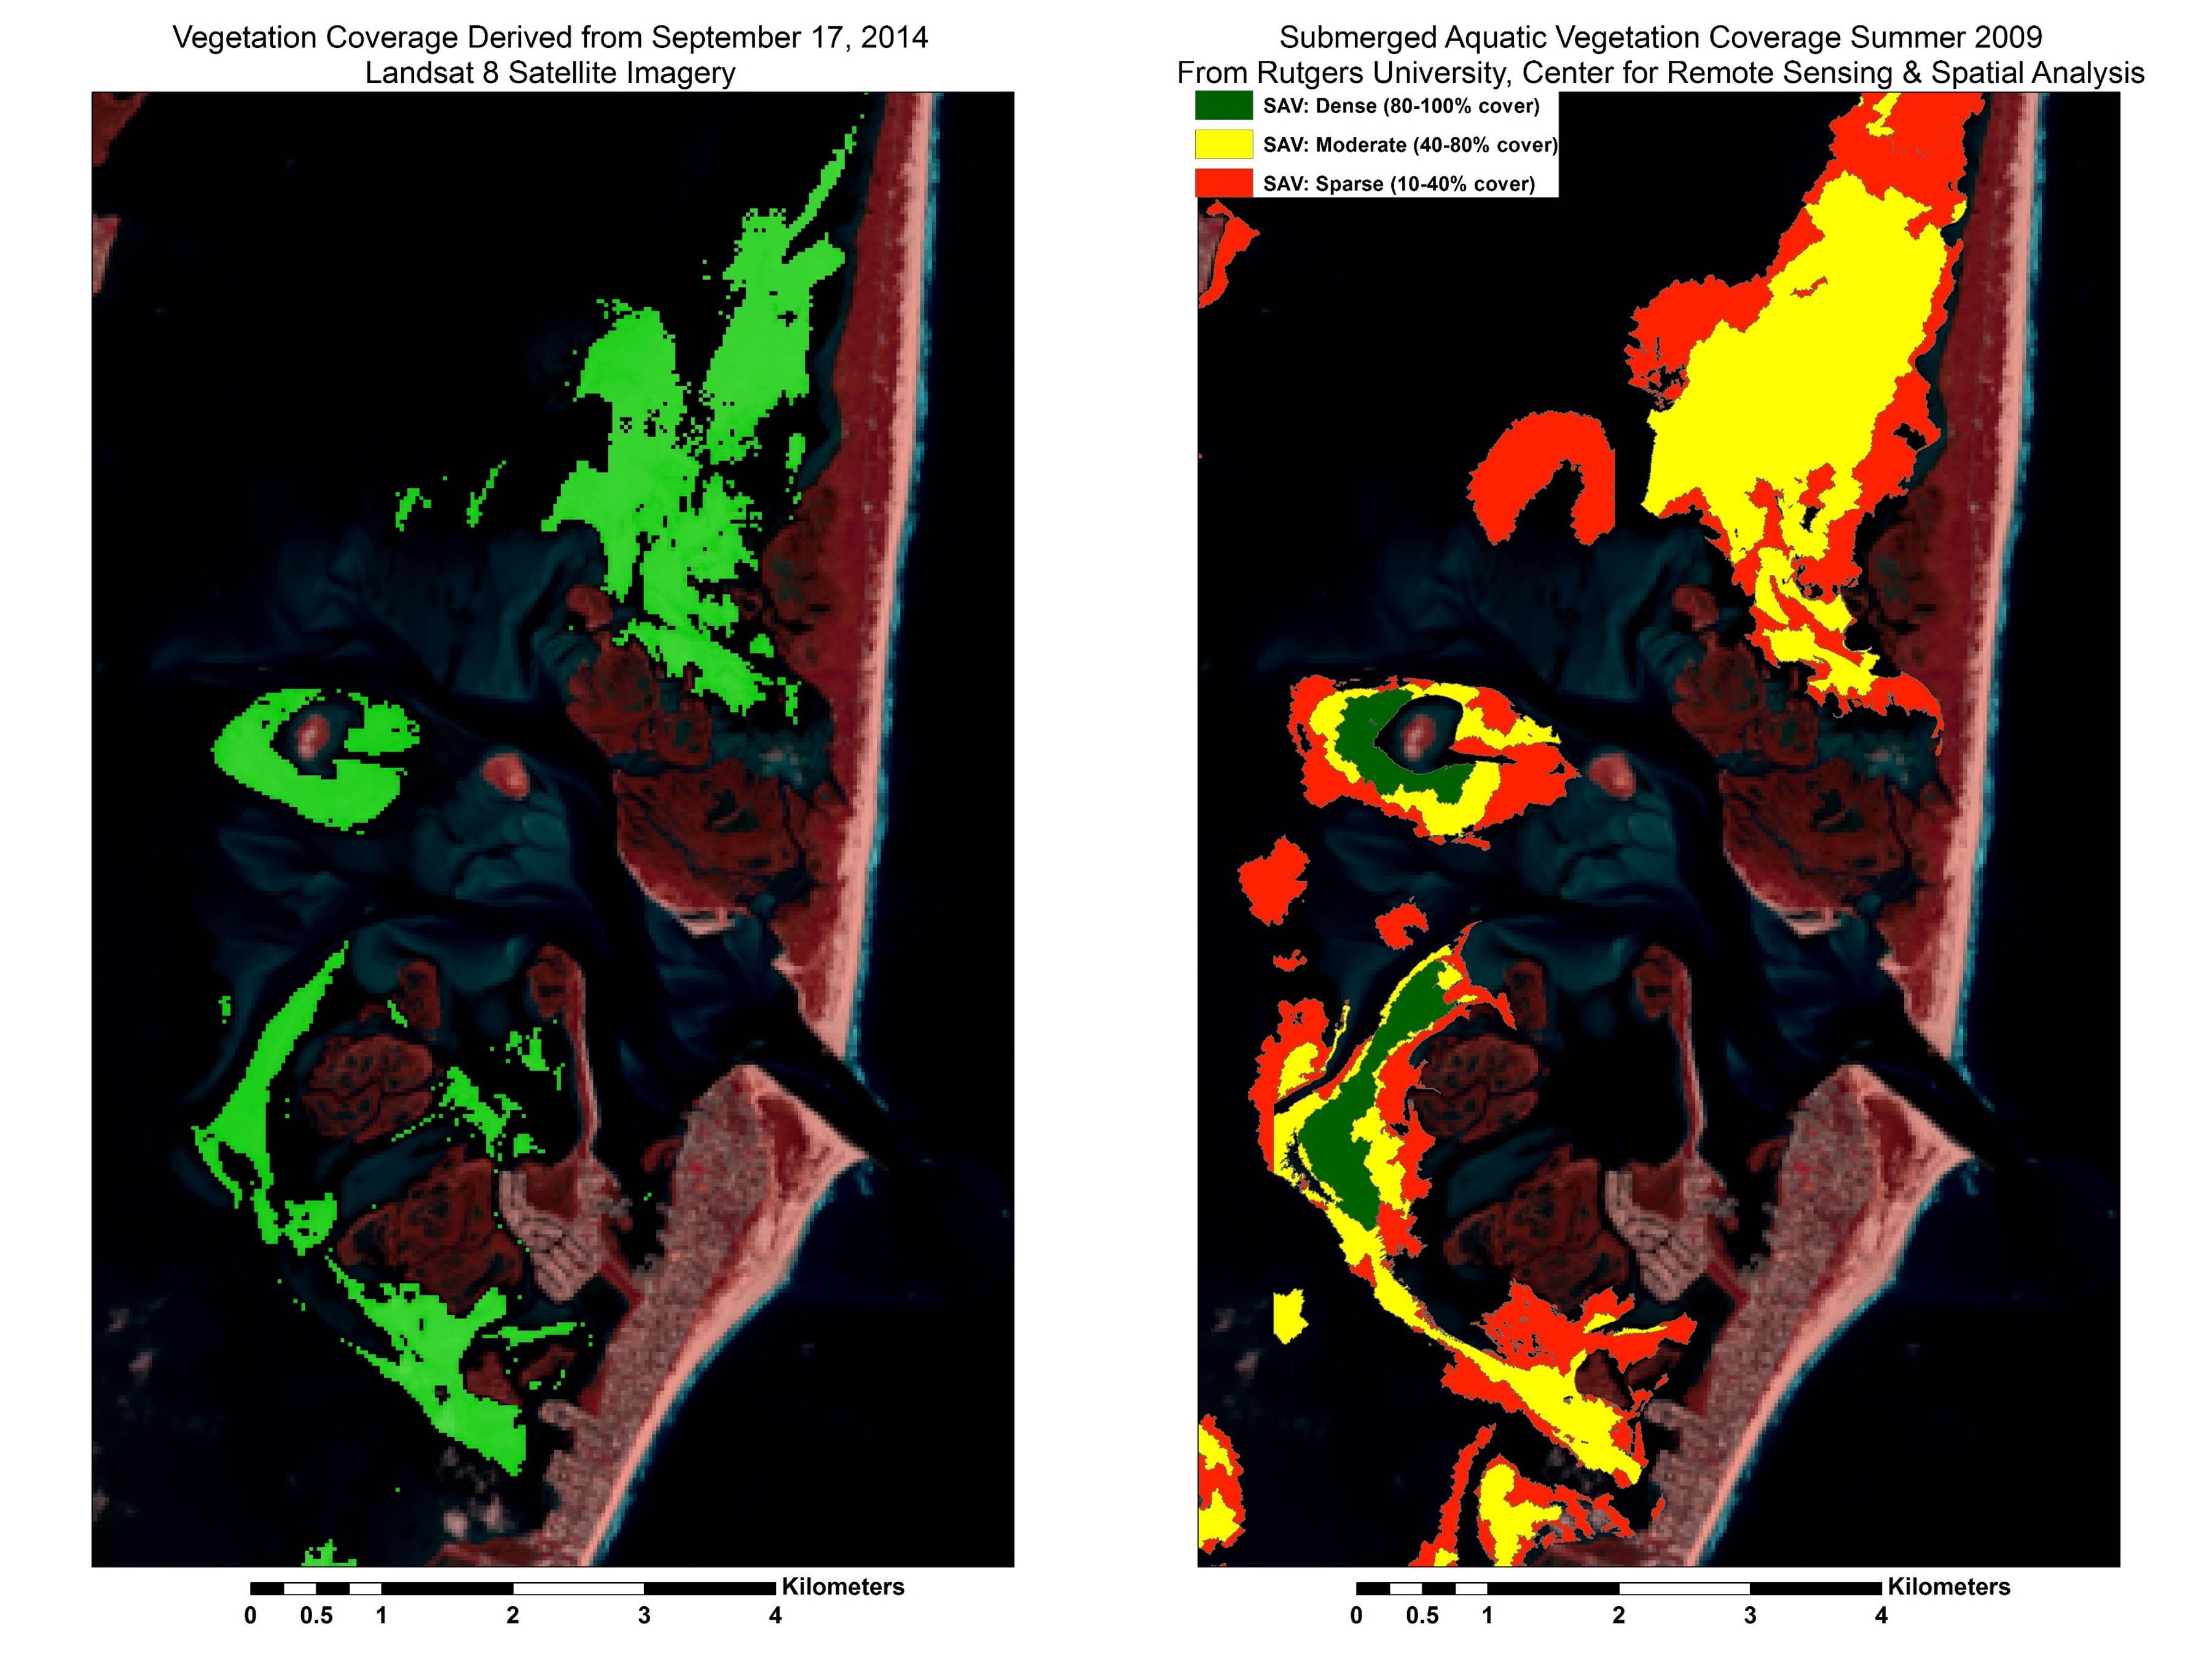
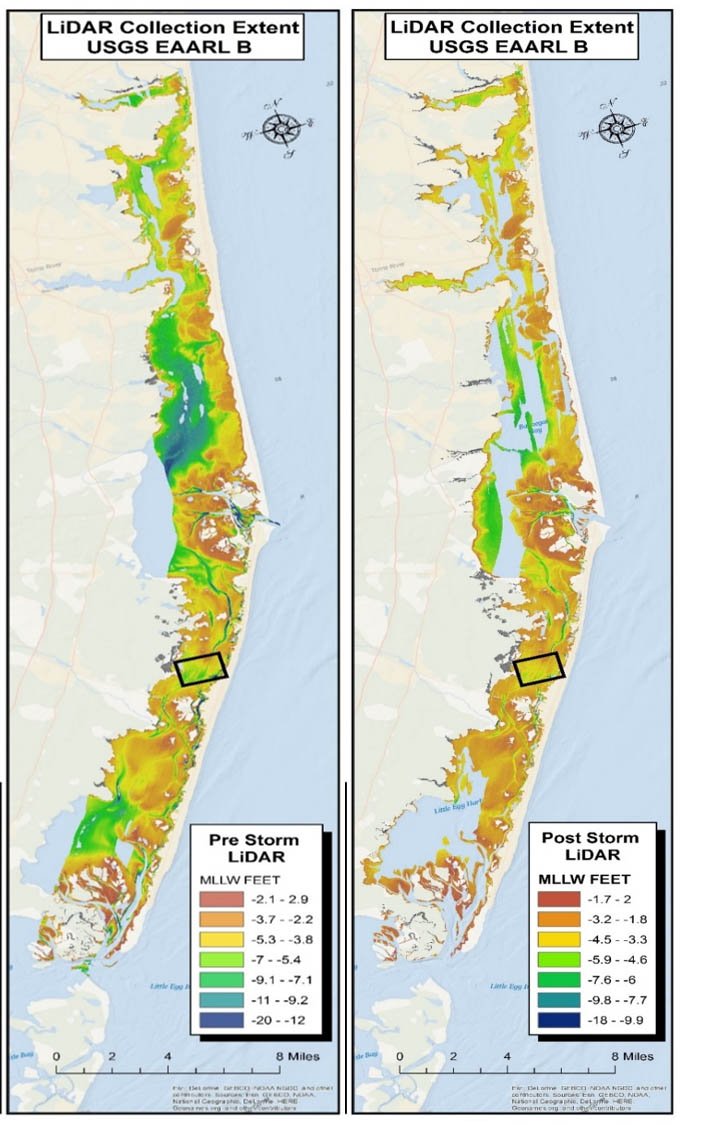 In addition to investigating the immediate impact of the storm with lidar data, we are also investigating long-term effects of the storm on benthic habitats in Barnegat Bay through multispectral satellite imagery and visual interpretation of multiple years over a 12 year period (2002 to 2014) of pre- and post-Super Storm Sandy high resolution aerial imagery and EAARL-B lidar derived bathymetry. Multispectral Landsat 8 satellite imagery is used to determine SAV using the visible and near-infrared bands (below left: habitat maps for SAV derived from Landsat 8 imagery). We are testing the results of our remotely-sensed data against historical SAV surveys conducted by the state of New Jersey and ground truth measurements, such as video imagery. The maps we generate from these data sets can be used in a comprehensive Coastal and Marine Ecological Classification Standard (CMECS) framework designed by NOAA to organize information about coasts and oceans and their living systems. Comparing habitat maps generated using these multiple data sources for pre- and post-storm may provide a means of assessing and quantifying change caused by Super Storm Sandy.
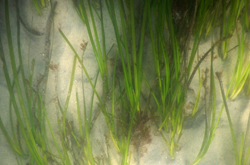