
You are here
Shoreline Research
Lidar (Light Detection and Ranging) data, collected by bouncing a laser pulse off the seabed from an airborne sensor, can be used to determine depths. Traditional bathymetric lidar systems only measured depths under water, but modern topographic-bathymetric lidars [TBLs] can collect data on land and in the near-shore region, giving potentially seamless coverage across the waterline. State of the art TBL systems being deployed in the Sandy-affected area can therefore be used to measure shoreline change and also analyze patterns of erosion and deposition. We are developing methods that will allow for more precise and rapid monitoring of these changes. These methods are being developed into a tool that can be utilized by government officials and engineers for future coastal planning and storm mitigation measures. The general public can also benefit from these results by becoming better informed of how future storm events may affect their coastal homes and communities.
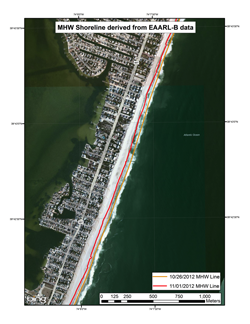 We are developing methodologies for shoreline change analyses, and analysis of erosion and deposition in the Sandy-impacted region, including, but not limited to Barnegat Bay, NJ, Long Beach Island, NJ, and Fire Island, NY, using TBL surveys collected before and after the storm by NOAA and JALBTCX partner agencies (e.g., USGS and USACE). The USGS have collected data using the newly developed EAARL-B system, the USACE acquired data with the CZMIL system, and NOAA National Geodetic Survey [NGS] collected data using the Riegl VQ-820-G system. As part of the analysis, we are referencing the lidar point cloud files to a consistent vertical datum using NOAA's VDatum software and generating Digital Elevation Models [DEMs]. From these surfaces, pre- and post-storm Mean-High-Water [MHW] and Mean-Lower-Low-Water [MLLW] contours can be extracted according to NOAA NGS's VDatum-based lidar shoreline extraction procedures (White, 2007). In order to include water bodies that were also impacted by Super Storm Sandy, such as estuaries and wetlands, we are testing the ability to extend NGS’s lidar shoreline mapping procedures into broader coastal areas. We are also investigating various methods for conducting shoreline change analysis in the Sandy-impacted region using shorelines extracted from the lidar data, with horizontal uncertainty being estimated for a portion of TBL survey data to test the ability of the Monte Carlo estimation method developed by White et al. (2011).
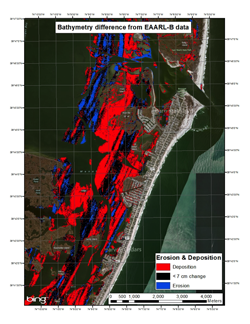 We are conducting analysis of erosion and deposition in Barnegat Bay, NJ using GIS workflows and showing these results with change maps (a preliminary result is shown on the left here). This analysis involves subtracting pre-storm DEMs from post-storm DEMs to determine where changes to the seafloor have occurred. While the DEM differencing procedures are relatively straightforward using readily-available GIS packages, a key component of this analysis is estimating vertical uncertainty of the grids, such that elevation differences below the total propagated uncertainty [TPU] are not depicted as actual changes. A variety of published techniques are being investigated for estimating the TPU in the elevation difference grids, and we expect to show the output maps at an appropriate level of granularity. In particular, erosion and deposition changes that are smaller than the calculated TPU of the difference grids must be classified as having "no change."
Another method being developed is using the Digital Shoreline Analysis System (DSAS), which is created by the USGS, to perform statistical analysis of the changing shoreline. Pre and post-storm shorelines are digitized into vector shapefiles in ArcMap and the DSAS extension is used to create transects, calculate distances, and to perform several calculations. These shorelines originate from lidar data, shoreline vector files from the NOAA Shoreline Data Explorer, and from digitized aerial imagery. Along with the DSAS statistics, which are provided within the DSAS extension, the transect distance data are being exported and additional statistics being calculated using MATLAB. A procedural document detailing how to use DSAS for working with post-storm shorelines has been created. The ongoing work with this section of the shoreline change includes creating a more robust MATLAB code for use with DSAS data and creating a procedural document for use with the code.
In addition to lidar, we are also using satellite-derived bathymetry (SDB) to monitor erosion and deposition in Barnegat Bay, NJ. It is possible to infer bathymetry based on the color changes (i.e., light attenuation) of the bottom. As light passes through the water column it decays exponentially. In our work we utilized two bands (blue and green) from satellite imagery to infer depth (Pe’eri et al., 2014). Based on the assumption that the water column is uniformly mixed, bottom radiance (color) of one band will decay faster with depth as compared to the other band. As a result, the ratio between the two bands will vary with depth (Stumpf et al., 2003)
Landsat 8 and WorldView-2 Satellite imagery were used to create a time series of bathymetric elevation models. The time series were used to monitor morphological changes (both natural trends and impacts from Super Storm Sandy event). The procedure included the following steps:
- All dry land (above water level), submersed aquatic vegetation (SAV), and optically-deep areas were masked from the imagery. Only exposed sediment (non-vegetated) areas were kept.
- Bathymetry from each image was derived using satellite-derived bathymetry (SDB) at 30-m resolution.
- A first derivative (slope) was calculated for all the bathymetric models.
- Using spatial analysis, differences between the bathymetric datasets were used to identify horizontal shifts over time.


