
You are here
Lidar Processing Research
Background
Measuring changes in very shallow water using traditional acoustic survey methods can prove to be difficult and time consuming. Lidar is an alternative technique for efficiently surveying substantial areas of shallow water (e.g., entire back bay regions). Furthermore, newly developed topographic-bathymetric lidar [TBL] systems can simultaneously measure topography and bathymetry, making lidar ideal for seamlessly mapping large extents of coastline. In storm situations, the ability to rapidly collect bathymetric data in areas where deploying acoustic survey vessels would be dangerous makes lidar a key tool for emergency response.
Waveform Metrics
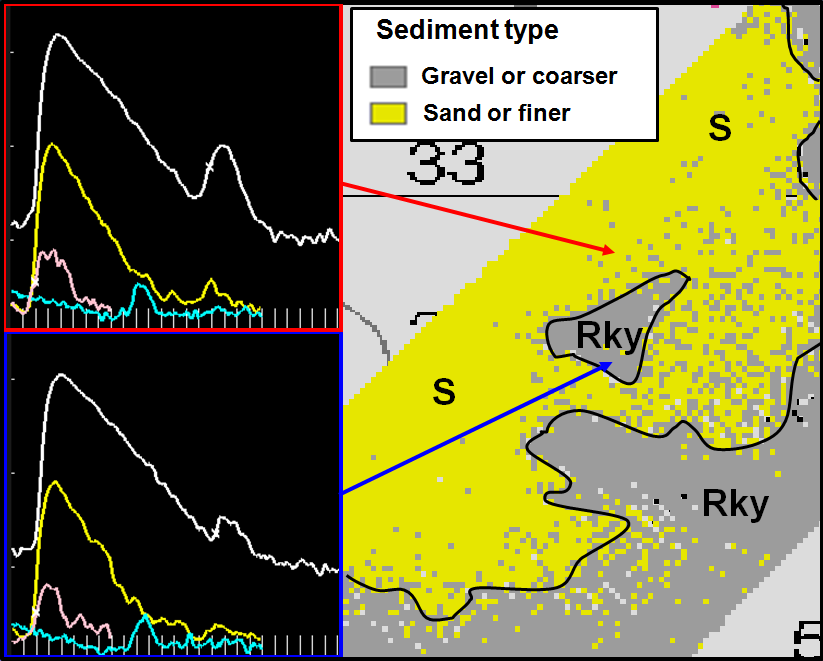 Airborne Lidar Bathymetry [ALB] sensors can store their measurements as an entire sequence of interactions of the laser pulse with the environment, generating a waveform. The waveform is a time series of the received light intensity relative to time. In standard ALB surveying conditions, in which the water clarity and the water depths allow for detectable bottom returns, the interactions of the green laser pulse with the water surface, water column, and the seafloor are observed as two peaks in the green-channel waveforms (right). The shape of each return characterizes the water medium and the interfaces (air/water and bottom). The state-of-the-art TBL systems now being deployed in the Sandy-impacted region offer the potential to exploit these features and create new products supporting multiple uses. However, extraction of enhanced information typically requires applying sophisticated digital signal processing to lidar waveforms. Many organizations that stand to benefit from these new products simply do not have this level of processing expertise, let alone access to the raw lidar waveform data. To address this challenge, we are investigating the ability to extract a number of simple, computationally efficient waveform features upstream in the processing workflow, such that they can be provided to end-users as new Integrated Ocean and Coastal Mapping multi-use products. These features will include waveform slopes, integrals, amplitudes, and statistical moments.
Shoreline Extraction
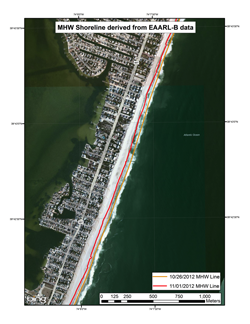 Lidar data can be used to measure shoreline change and also analyze patterns of erosion and deposition (right: effects of Super Storm Sandy on shoreline in Barnegat Bay, NJ). We are developing methods that will allow for more precise and rapid monitoring of these changes. These methods can be developed into a tool that can be utilized by government officials and engineers for future coastal planning and storm mitigation measures. The general public can also benefit from these results by becoming better informed of how future storm events may affect their coastal homes and communities. We are developing methodologies for shoreline change analyses, and analysis of erosion and deposition in the Sandy-impacted region using TBL surveys collected before and after the storm by NOAA and JALBTCX partner agencies (e.g., USGS and USACE). In order to include water bodies that were also impacted by Super Storm Sandy, such as estuaries and wetlands, we are testing the ability to extend NGS’s lidar shoreline mapping procedures into broader coastal areas. We are investigating various methods for conducting shoreline change analysis in the Sandy-impacted region using shorelines extracted from the lidar data, with horizontal uncertainty being estimated for a portion of TBL survey data to test the ability of the Monte Carlo estimation method.
Sediment Distribution Changes/Bathymetry
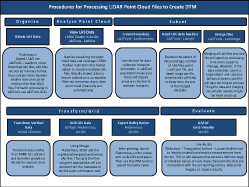 We are conducting analysis of erosion and deposition in Barnegat Bay, NJ using GIS workflows and depicting the results with change maps (right: workflow for DEM creation). This analysis involves subtracting pre-storm DEMs from post-storm DEMs to determine where changes to the seafloor have occurred. While the DEM differencing procedures are relatively straightforward using readily-available GIS packages, a key component of this analysis entails estimating vertical uncertainty of the grids, such that elevation differences below the total propagated uncertainty [TPU] are not depicted as actual changes so that the output maps can be displayed at an appropriate level of granularity.


