
You are here
Marine Debris Research
Background
Marine debris is typically defined as any man-made object discarded, disposed of, or abandoned that enters the coastal or marine environment. While most studies of marine debris have focused on floating or near surface objects, we are focusing on submerged marine debris, targeting debris that is greater than or equal to one cubic meter in size. We are exploring the use of automated approaches to identify and classify submerged marine debris, using the techniques developed for the detection of mines, unexploded ordinance and pipelines as a starting point. As aim to adapt algorithms to the recognition and inventory of marine debris, attempting to reduce the time required by human analysts to process large amounts of data.
Many algorithms for object detection have poor performance in practice since the conditions present in test scenarios are often not representative of the conditions used to develop and train the algorithm. Gathering a robust test set that fully explores all parts of the potential object set that will be encountered in the field is, however, extremely difficult (and often time-consuming). The solution, therefore, is in development of algorithms than can appropriately respond to changes in the environment, detection context, and the skills of human operators. In other words, the algorithms need to attempt to adapt to the new underlying test-data distributions in case they are not sufficiently well represented in the training data. We are researching techniques that allow algorithms to adapt to these changes (using operator-meaningful parameters), and to use multiple algorithms (that look at the data in different ways) in conjunction to improve the overall performance.
Identification of individual targets is an important aspect of tackling the marine debris problem, but working on individual targets is only part of the problem. To be effective, any technique needs to be able to handle aggregations of targets, enabling the analysis of spatial distributions, meta-analysis, and inventory. We are building methods enabling the construction of a marine debris inventory through use of a spatial relational database. Having the results of object detection and filtering activities available as a spatial database allows us to consider the feasibility of a marine site risk index for marine debris prioritization.
Marine Target Detection and Object Recognition (Matador)
A modular software library, called Matador, has been developing with the main aim to provide a fusion adaptive algorithm able to quickly and effectively detect and recognize the possible presence of marine debris from large datasets collected with commercial systems after a major disaster like a tsunami or a hurricane. Such a task involves some degree of modeling and approximation to make the analysis computationally attractive and sufficiently effective in practice (i.e., an approximate solution with a well-structured model is preferred to an exact solution with a suboptimal model).
One of the main issues of this project is about the consistent nature and definition of marine debris together with the extreme variability of the marine environment, and the variable skill levels of human operators. This condition requires efforts for the correct adoption and implementation of different techniques developed in similar fields of research such as mine hunting, localization of unexploded ordnance or pipeline detection. A target model was built postulating a simplified description of the object properties, and a detector was specifically outlined for marine debris, detecting discrete objects which differ (e.g., protrude) from the surrounding seafloor, being close or connected to the bottom. The scope of the detector has been also specifically tailored to analyze products commonly available in existing post processing software (mainly, bathymetric digital terrain models (DTM) and backscatter mosaics with several associated data sets, such as statistics derived from the core data, or during construction) so that the technique may be quickly inserted into existing workflows, which eases resource management in a response situation.
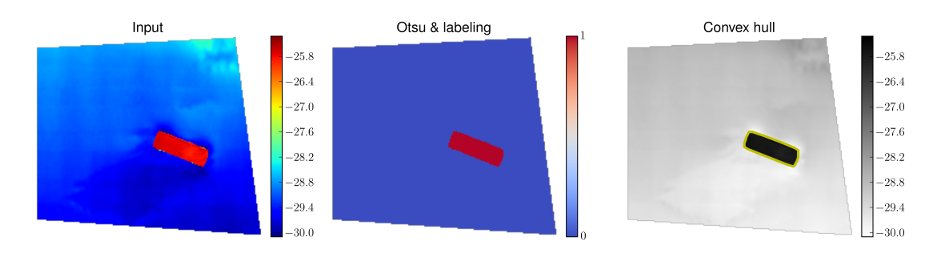
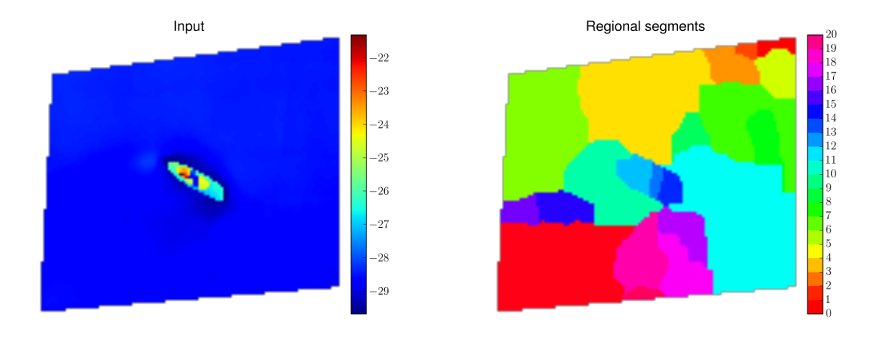
Currently, techniques based on DTM analysis have been investigating. Due the variability of possible targets, some of them have better performance with some type of targets than others. For instance, a threshold-based algorithm, as the one described in Figure 1, is usually able to well identify a flat sunk barge, where an edge detector is better suited for target characterized by more irregular and varying surfaces (Figure 2).

An additional relevant topic that is currently under analysis is represented by the inherent multiple scales of marine debris. In fact, the size of the investigated targets can be quite varying from a minimum related to the device resolution, used to acquire the data, to dozens of meters or even more. A regional minima approach at variable scale represents a possible solution to create a hierarchy of spatial areas (Figure 3). Such a multi-level solution also provides means to split the computational burden by topological aggregation of similar seafloor patches.
For both backscatter and bathymetry, the adoption of classical estimation techniques generates point estimate or a confidence interval, which becomes important when fusion of target information coming from different products is attempted. In order to provide appropriate distributions for exploitation, Bayesian methods were adopted since they permit use of multiple-source asymmetric and discontinuous posterior distributions that may be carried into further analysis. A hierarchical scheme is proposed where a series of modeling tasks are implemented through a probabilistic model, casting the debris detection problem as one of estimating properties of the posterior distribution describing the probability of objects occurring given the observed data products.
A Bayesian Marine Debris Detector
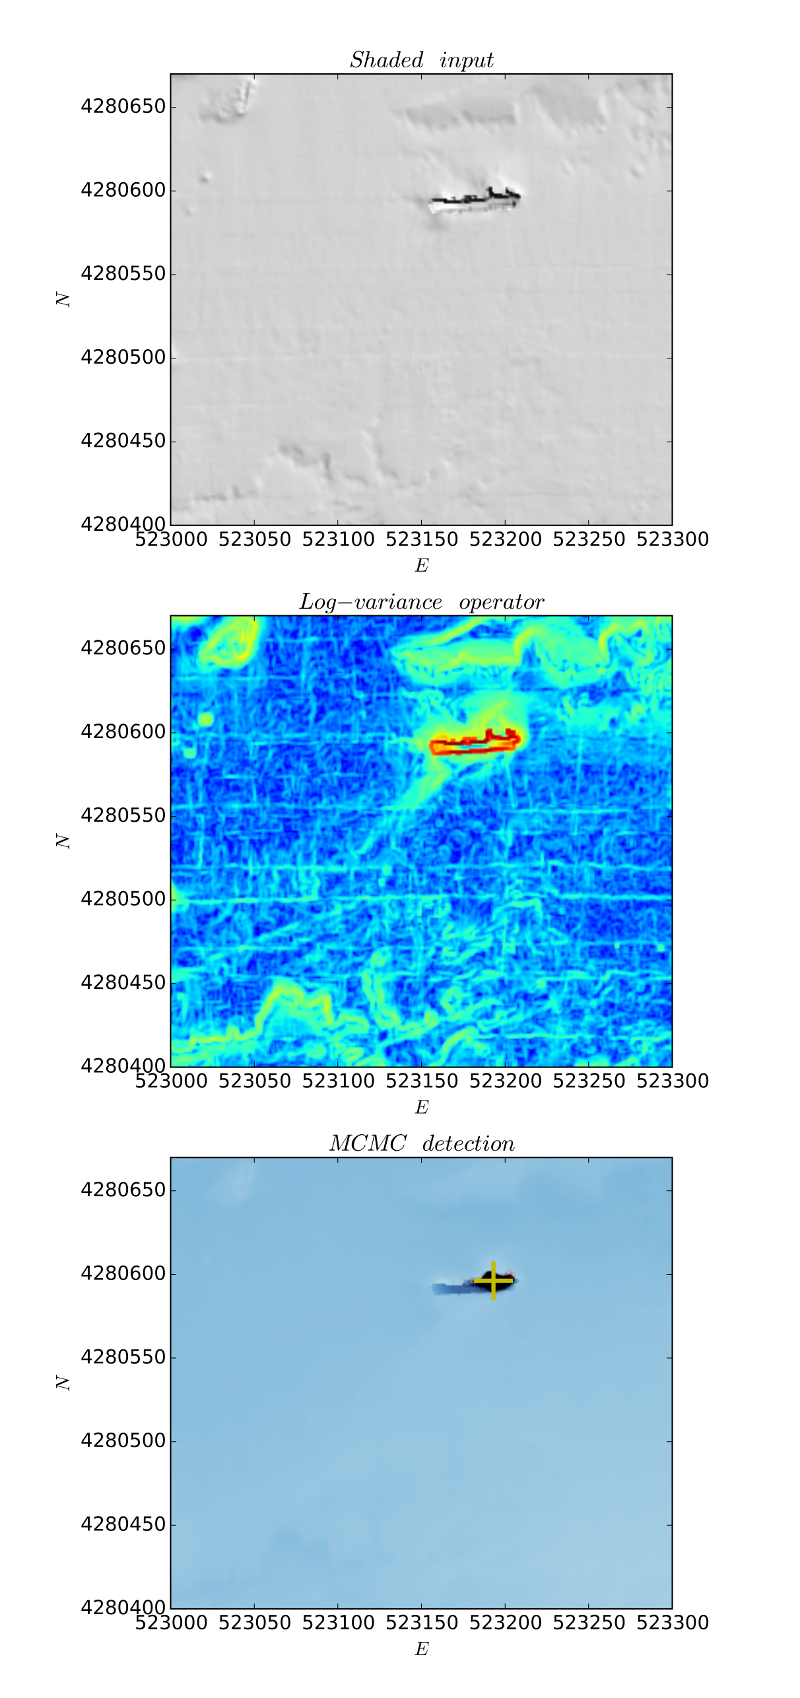
A Markov chain Monte Carlo (MCMC) system is used to estimate probability of object presence on a per pixel/node basis. The data probability under the hypothesis of having marine debris is produced by the detector from different types of products, related both to bottom detection (depth) and to the intensity time series usually collected over it (backscatter).
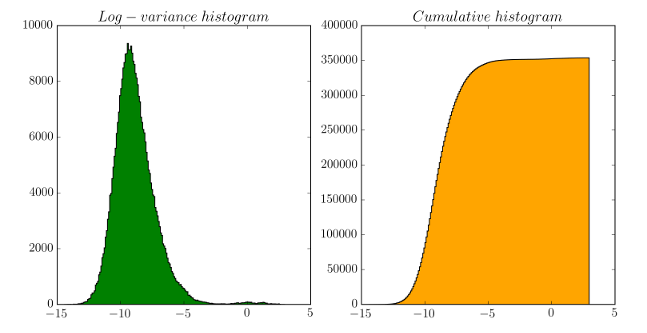
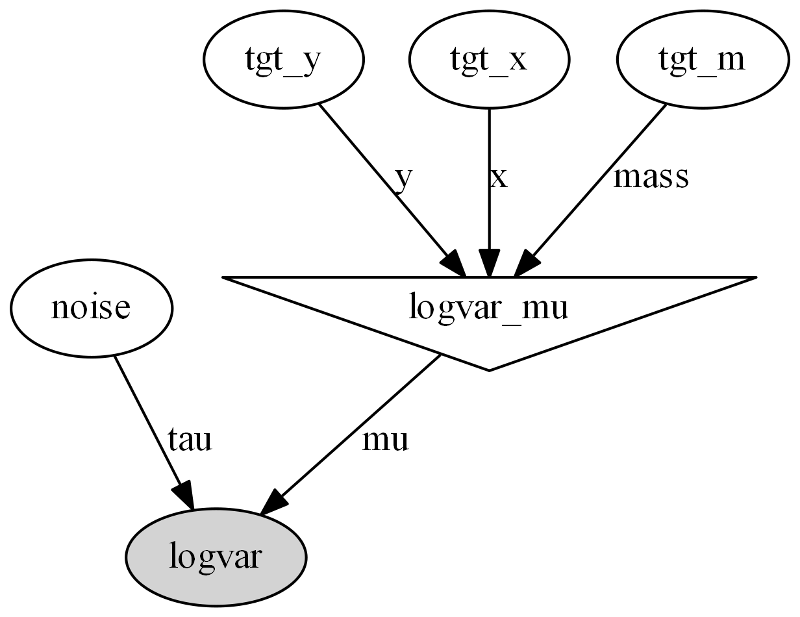
In order to avoid over-fitting and to maintain reasonable the computation associated, the hierarchical model is maintained as simple as possible. For instance, taking advantage of the neat clustering division observed by applying a developed log variance operator (Figure 4), the process involved in the data creation around a target was modeled with only two components: the position and the mass (Figure 5).
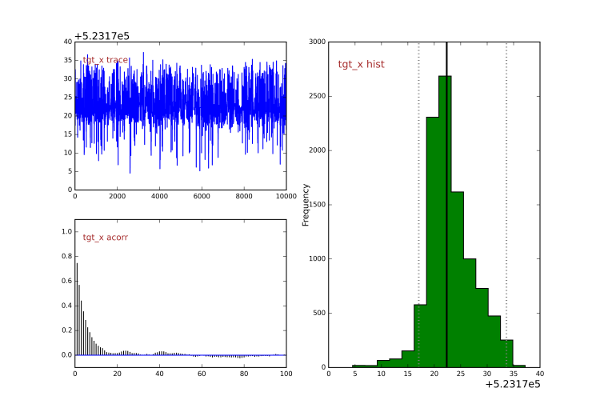
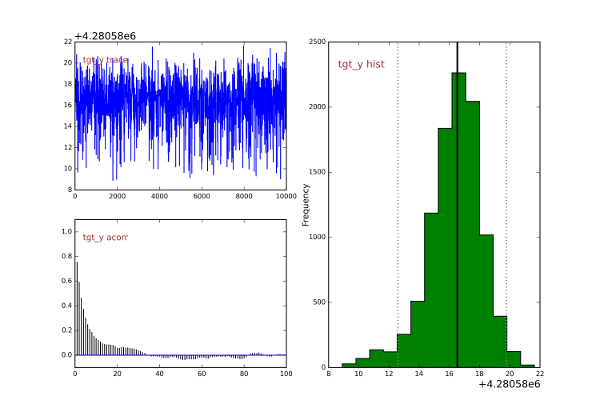
In such a specific case, a Markov Chain Monte Carlo (MCMC) was then applied (Figure 6), and the target position was identified as the maximum a posteriori probability (MAP) to minimize the loss function (Figure 7).
The expected outcome of the overall fusion approach is the reduction of inter-algorithmic cross-correlation and, thus, the probability of false alarm. Since the framework provides sufficient flexibility to integrate additional source of information, extension of the detector with a set of ad hoc hydrographic products is currently investigated with the intent to improve the detection performance.
The Huddl Approach For Raw Data Access
After any major marine disaster a large amount of raw data is often acquiredin a number of different formats. Essentially, every manufacturer has developed its own format specifications, and development during the years of existing or new acquisition systems usually drives a certain number of specifications releases. Many of the attempts to introduce a universal hydrographic data format have failed or have been only partially successful. In essence, this is because such formats either have to simplify the data to such an extent that they only support the lowest common subset of all the formats covered, or they attempt to be a superset of all formats and quickly become cumbersome. Neither choice works well in practice. This issue is coupled with a lack of a common repository for hydrographic data formats. Such a situation implies the need to navigate different manufacturer websites in order to obtain the required release of a given data format, too often driven by issues experienced after having attempted to read new survey lines. A worse inhomogeneity is present in data parsers or tools for conversion among different data formats, and they are only available for a limited number of format pairs (some for free, the largest part with a cost).
Our long-term solution to this issue is the adoption of a descriptive language flexible enough to describe all the past, the existing, and the future hydrographic data formats: the Hydrographic Universal Data Description Language (Huddl). The key point of the Huddl approach is the idea to describe the existing formats as they are rather than define another chimeric format able to encapsulate the amount of information present in all the existing data formats (with all the related semantic issues in case a conversion is attempted). More information about the language and related tools, that have been developing at the Center for a few years, are available on the Huddl website.
Data Output Integration
The output of the tool will be a marine debris list stored in a geodatabase with information organized using ISO Geographic Markup Language [GML] schemas, ready to be used in web GIS (through ERMA and GeoPlatform implementations) and environmental databases (e.g., NOAA RULET/RUST) through a process of automatic translation.


