About the Project
At 1930 EDT on the 29th of October 2012, Super Storm Sandy made landfall on the U.S. east coast near Brigantine, NJ. The convergence of the storm with an intense low-pressure system, its unusual approach direction (from the east rather than from the south) and its coincidence with astronomically high tides made Super Storm Sandy one of the deadliest and costliest hurricanes in U.S. history, causing 147 deaths in the U.S. and more than 50 billion dollars in damages (costs are still being tallied). Most of the damage caused by Super Storm Sandy was focused on the coastal zone, with flooding (the hurricane caused record high storm surges in New York, New Jersey and Connecticut), high winds and powerful waves resulting in the destruction of buildings, homes, roads, vehicles, and many other objects over hundreds of miles of coast.
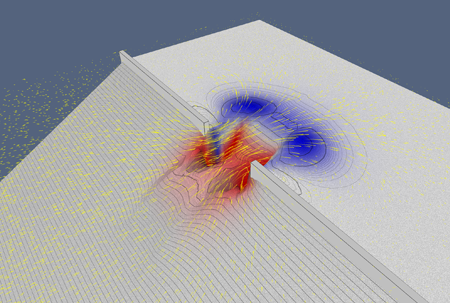
The Center for Coastal and Ocean Mapping was awarded funding to support research into methods for mapping in support of storm response activities. This 24-month funded effort is intended to investigate methods for assessing the changes in the environment caused by events like Super Storm Sandy, to develop data processing methods for acoustic and lidar data collected as part of a storm response, to establish best practice methodologies for these data processing methods, and to examine data presentation and visualization methods for communication of the results of these investigations. |
Infographics
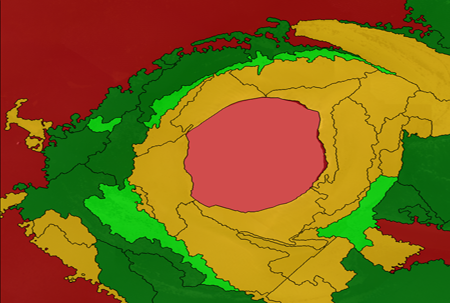
Infographics are visual descriptions of the complex data being used for response to Super Storm Sandy. This collection attempts to communicate what's happening in an easily digestible form.
Our infographics are designed to let you examine the data that we're collecting as part of our Super Storm Sandy research in a more intuitive way. You can interact with the data, find out what we're doing in your area, and what information we have available to help you understand the current state of the Super Storm Sandy response. They also try to show you how we deal with the data here at CCOM so you can understand what we're trying to do with our research.
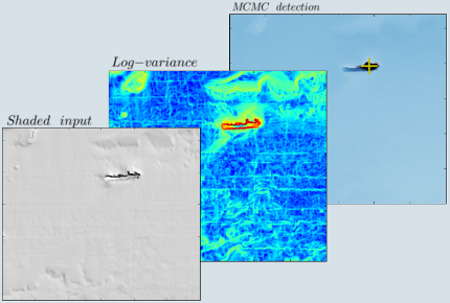
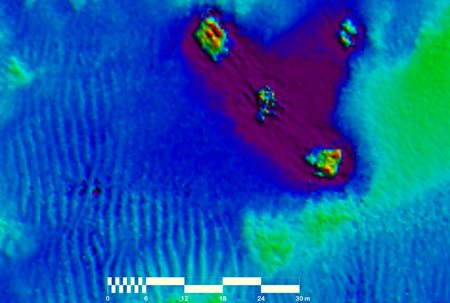
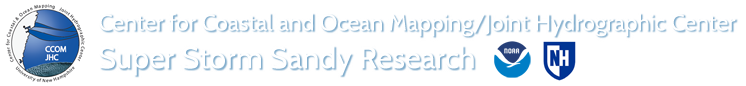
Featured: Interactive map showing marine debris detected along the east coast of the U.S.
|
Data Sources
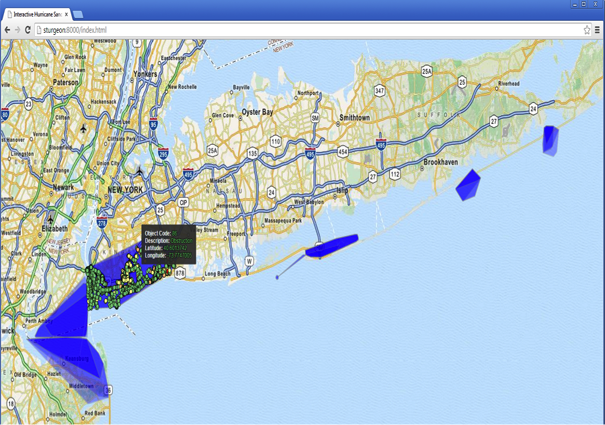
As the research progresses, more derived datasets are being constructed, all of which are available for download, and suitable for pulling into your own projects.
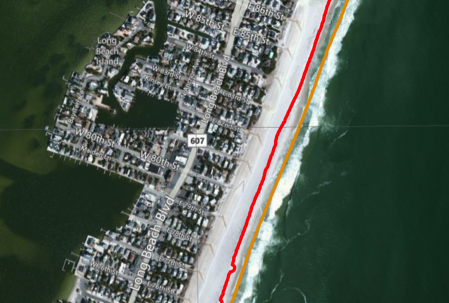
Featured: Shoreline change in Barnegat Bay, NJ derived from NOAA lidar data.
|


![]()
Chase Ocean Engineering Lab • 24 Colovos Road • Durham, NH 03824
Phone: 603.862.3438 • Fax: 603.862.0839
lat/lon: 43.13555; -70.9395
This website and its content are the copyright of the University of New Hampshire.
Copyright © 2014 The University of New Hampshire, Durham, NH 03824